Estimated Value: $147,000 - $174,000
1
Bed
1
Bath
550
Sq Ft
$299/Sq Ft
Est. Value
About This Home
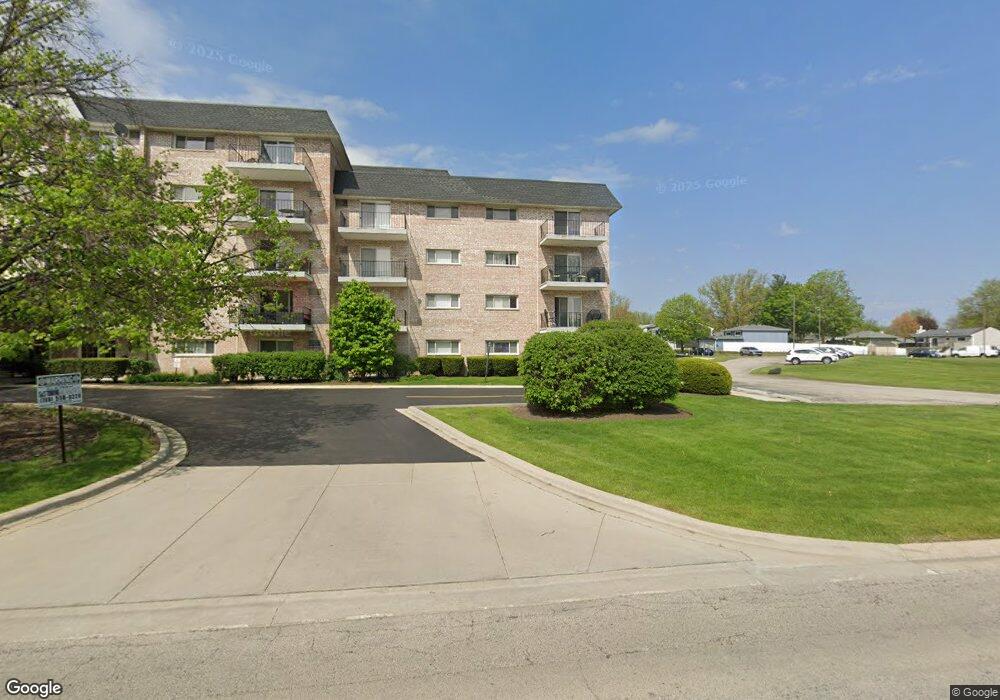
This home is located at 1000 S Lorraine Rd Unit 312, Wheaton, IL 60189 and is currently estimated at $164,314, approximately $298 per square foot. 1000 S Lorraine Rd Unit 312 is a home located in DuPage County with nearby schools including Lincoln Elementary School, Haines Elementary School, and Nelson Prairie School.
Ownership History
Date
Name
Owned For
Owner Type
Purchase Details
Closed on
Feb 3, 2017
Sold by
Scifo Madeline A
Bought by
Scifo Madeline A and Scifo Mark
Current Estimated Value
Purchase Details
Closed on
Aug 31, 2010
Sold by
Morrow Brian S and Morrow Kathryn
Bought by
Seifo Madeline A and Gajda Marie S
Purchase Details
Closed on
Nov 30, 2007
Sold by
Cregar Christopher
Bought by
Morrow Brian S
Home Financials for this Owner
Home Financials are based on the most recent Mortgage that was taken out on this home.
Original Mortgage
$125,000
Interest Rate
6.33%
Mortgage Type
Purchase Money Mortgage
Purchase Details
Closed on
May 26, 2005
Sold by
1000 South Lorraine Llc
Bought by
Cregar Christopher
Home Financials for this Owner
Home Financials are based on the most recent Mortgage that was taken out on this home.
Original Mortgage
$92,440
Interest Rate
5.87%
Mortgage Type
Fannie Mae Freddie Mac
Create a Home Valuation Report for This Property
The Home Valuation Report is an in-depth analysis detailing your home's value as well as a comparison with similar homes in the area
Home Values in the Area
Average Home Value in this Area
Purchase History
| Date | Buyer | Sale Price | Title Company |
|---|---|---|---|
| Scifo Madeline A | -- | Attorney | |
| Seifo Madeline A | $99,000 | Bt | |
| Morrow Brian S | $125,000 | Secure Title Llc | |
| Cregar Christopher | $115,000 | Ctic |
Source: Public Records
Mortgage History
| Date | Status | Borrower | Loan Amount |
|---|---|---|---|
| Previous Owner | Morrow Brian S | $125,000 | |
| Previous Owner | Cregar Christopher | $92,440 | |
| Closed | Cregar Christopher | $23,000 |
Source: Public Records
Tax History Compared to Growth
Tax History
| Year | Tax Paid | Tax Assessment Tax Assessment Total Assessment is a certain percentage of the fair market value that is determined by local assessors to be the total taxable value of land and additions on the property. | Land | Improvement |
|---|---|---|---|---|
| 2024 | $2,256 | $43,000 | $6,497 | $36,503 |
| 2023 | $2,134 | $39,580 | $5,980 | $33,600 |
| 2022 | $1,366 | $25,720 | $5,650 | $20,070 |
| 2021 | $1,353 | $25,110 | $5,520 | $19,590 |
| 2020 | $1,345 | $24,880 | $5,470 | $19,410 |
| 2019 | $1,305 | $24,230 | $5,330 | $18,900 |
| 2018 | $1,102 | $21,220 | $4,670 | $16,550 |
| 2017 | $960 | $18,930 | $4,170 | $14,760 |
| 2016 | $930 | $18,170 | $4,000 | $14,170 |
| 2015 | $904 | $17,340 | $3,820 | $13,520 |
| 2014 | $2,124 | $32,200 | $3,790 | $28,410 |
| 2013 | $2,070 | $32,290 | $3,800 | $28,490 |
Source: Public Records
About This Building
Map
Nearby Homes
- 1000 S Lorraine Rd Unit 412
- 1000 S Lorraine Rd Unit 315
- 1000 S Lorraine Rd Unit 214
- 850 S Lorraine Rd Unit 1G
- 850 S Lorraine Rd Unit 3L
- 1240 S Lorraine Rd Unit 2B
- 1407 Wilson Ave
- 1316 Wilson Ave
- 215 Orchard Ln
- 1244 Loughborough Ct
- 1581 Groton Ln
- 1038 Liskeard Ct
- 305 S Lambert Rd
- 1026 Briarcliffe Blvd
- 722 E Indiana St
- 1129 Rhodes Ct
- 216 N Blanchard St
- 386 Sandhurst Cir Unit 2
- 63 S Main St
- 55 S Main St
- 1000 S Lorraine Rd Unit 306
- 1000 S Lorraine Rd Unit 301
- 1000 S Lorraine Rd Unit 509
- 1000 S Lorraine Rd Unit 305
- 1000 S Lorraine Rd Unit 102
- 1000 S Lorraine Rd Unit 109
- 1000 S Lorraine Rd Unit 411
- 1000 S Lorraine Rd Unit 103
- 1000 S Lorraine Rd Unit 415
- 1000 S Lorraine Rd Unit 302
- 1000 S Lorraine Rd Unit 101
- 1000 S Lorraine Rd Unit 505
- 1000 S Lorraine Rd Unit 213
- 1000 S Lorraine Rd Unit 506
- 1000 S Lorraine Rd Unit 106
- 1000 S Lorraine Rd Unit 208
- 1000 S Lorraine Rd Unit 202
- 1000 S Lorraine Rd Unit 108
- 1000 S Lorraine Rd Unit 105
- 1000 S Lorraine Rd Unit 507