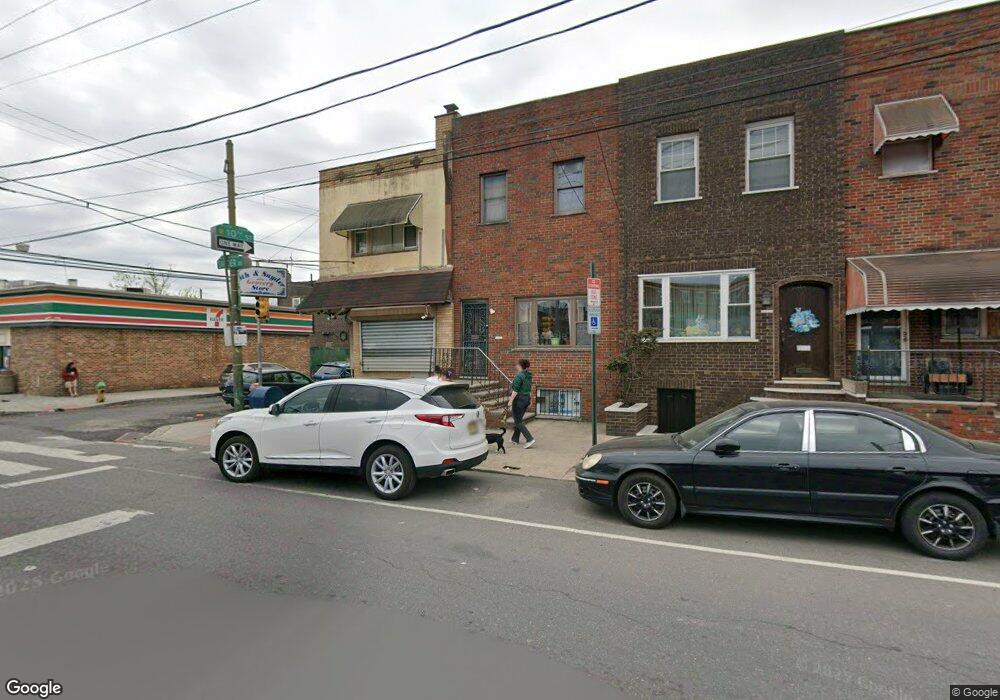
1000 Snyder Ave Philadelphia, PA 19148
South Philadelphia East Neighborhood
3
Beds
1
Bath
1,680
Sq Ft
871
Sq Ft Lot
About This Home
This home is located at 1000 Snyder Ave, Philadelphia, PA 19148. 1000 Snyder Ave is a home located in Philadelphia County with nearby schools including South Philadelphia High School, Key Francis Scott School, and Our Lady of Hope.
Ownership History
Date
Name
Owned For
Owner Type
Purchase Details
Closed on
Jul 21, 2010
Sold by
Wells Fargo Bank Na
Bought by
Huang Hui Zhen
Purchase Details
Closed on
Mar 15, 2010
Sold by
Dimarino Frank
Bought by
Wachovia Bank Na
Purchase Details
Closed on
Feb 3, 2007
Sold by
Glick Thomas A and Glick Deborah A
Bought by
Dimarino Frank
Home Financials for this Owner
Home Financials are based on the most recent Mortgage that was taken out on this home.
Original Mortgage
$223,959
Interest Rate
6.24%
Mortgage Type
Commercial
Purchase Details
Closed on
Sep 1, 2005
Sold by
Romeo Cheryl
Bought by
Glick Thomas A and Glick Deborah A
Home Financials for this Owner
Home Financials are based on the most recent Mortgage that was taken out on this home.
Original Mortgage
$196,500
Interest Rate
5.92%
Mortgage Type
Commercial
Purchase Details
Closed on
May 15, 2003
Sold by
Baselice Donato and Will Of Louis Baselice
Bought by
Romeo Cheryl
Home Financials for this Owner
Home Financials are based on the most recent Mortgage that was taken out on this home.
Original Mortgage
$120,000
Interest Rate
5.83%
Mortgage Type
Commercial
Create a Home Valuation Report for This Property
The Home Valuation Report is an in-depth analysis detailing your home's value as well as a comparison with similar homes in the area
Home Values in the Area
Average Home Value in this Area
Purchase History
| Date | Buyer | Sale Price | Title Company |
|---|---|---|---|
| Huang Hui Zhen | $170,000 | Servicelink | |
| Wachovia Bank Na | $160,000 | None Available | |
| Dimarino Frank | $300,000 | None Available | |
| Glick Thomas A | $230,000 | None Available | |
| Romeo Cheryl | $150,000 | -- |
Source: Public Records
Mortgage History
| Date | Status | Borrower | Loan Amount |
|---|---|---|---|
| Previous Owner | Dimarino Frank | $223,959 | |
| Previous Owner | Glick Thomas A | $196,500 | |
| Previous Owner | Romeo Cheryl | $120,000 |
Source: Public Records
Tax History Compared to Growth
Tax History
| Year | Tax Paid | Tax Assessment Tax Assessment Total Assessment is a certain percentage of the fair market value that is determined by local assessors to be the total taxable value of land and additions on the property. | Land | Improvement |
|---|---|---|---|---|
| 2025 | $3,178 | $234,500 | $46,900 | $187,600 |
| 2024 | $3,178 | $234,500 | $46,900 | $187,600 |
| 2023 | $3,178 | $227,000 | $45,400 | $181,600 |
| 2022 | $2,907 | $227,000 | $45,400 | $181,600 |
| 2021 | $2,907 | $0 | $0 | $0 |
| 2020 | $2,907 | $0 | $0 | $0 |
| 2019 | $2,879 | $0 | $0 | $0 |
| 2018 | $2,797 | $0 | $0 | $0 |
| 2017 | $3,521 | $0 | $0 | $0 |
| 2016 | $3,521 | $0 | $0 | $0 |
| 2015 | $3,370 | $0 | $0 | $0 |
| 2014 | -- | $251,500 | $13,030 | $238,470 |
Source: Public Records
Map
Nearby Homes
- 639 Cantrell St
- 1021 Cantrell St
- 952 Winton St
- 934 Snyder Ave
- 924 Cantrell St
- 926 Winton St
- 1018 Jackson St
- 1037 Snyder Ave
- 919 Snyder Ave
- 914 Winton St
- 1106 Cantrell St
- 2015 S Hutchinson St Unit 12
- 1105 Snyder Ave
- 1116 Cantrell St
- 2109 S 9th St
- 2125 S 9th St
- 838 Snyder Ave
- 1133 Winton St
- 905 Daly St
- 905 Emily St
- 1002 Snyder Ave
- 1004 Snyder Ave
- 1006 Snyder Ave
- 1001 Cantrell St Unit 1ST FL
- 1001 Cantrell St
- 1003 Cantrell St
- 1008 Snyder Ave
- 1005 Cantrell St
- 1007 Cantrell St
- 1010 Snyder Ave
- 1009 Cantrell St
- 1012 Snyder Ave
- 1011 Cantrell St
- 953-55 Cantrell St
- 953 Cantrell St
- 1013 Cantrell St
- 1014 Snyder Ave
- 1015 Cantrell St
- 951 Cantrell St
- 408-410 Cantrell St