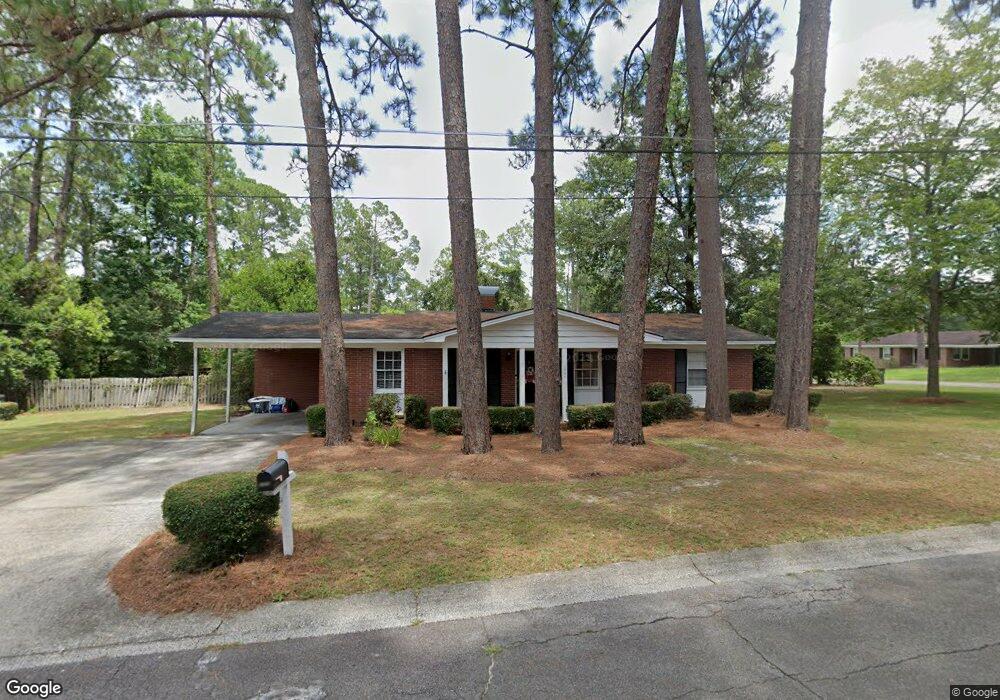
1000 Tupelo Dr Waycross, GA 31501
Estimated Value: $154,989 - $182,000
3
Beds
2
Baths
1,490
Sq Ft
$116/Sq Ft
Est. Value
About This Home
This home is located at 1000 Tupelo Dr, Waycross, GA 31501 and is currently estimated at $172,497, approximately $115 per square foot. 1000 Tupelo Dr is a home located in Ware County with nearby schools including Williams Heights Elementary School, Waycross Middle School, and Ware County High School.
Ownership History
Date
Name
Owned For
Owner Type
Purchase Details
Closed on
Aug 10, 2021
Sold by
Duncan Sandra K
Bought by
Starling Chad L
Current Estimated Value
Purchase Details
Closed on
Nov 10, 2011
Sold by
Duncan Sandra K
Bought by
Duncan Sandra K and Starling Chad L
Home Financials for this Owner
Home Financials are based on the most recent Mortgage that was taken out on this home.
Original Mortgage
$30,000
Interest Rate
7.75%
Mortgage Type
Adjustable Rate Mortgage/ARM
Purchase Details
Closed on
Nov 2, 2011
Sold by
Cowart Tony D
Bought by
Duncan Sandra K
Home Financials for this Owner
Home Financials are based on the most recent Mortgage that was taken out on this home.
Original Mortgage
$30,000
Interest Rate
7.75%
Mortgage Type
Adjustable Rate Mortgage/ARM
Purchase Details
Closed on
Dec 31, 1987
Create a Home Valuation Report for This Property
The Home Valuation Report is an in-depth analysis detailing your home's value as well as a comparison with similar homes in the area
Home Values in the Area
Average Home Value in this Area
Purchase History
| Date | Buyer | Sale Price | Title Company |
|---|---|---|---|
| Starling Chad L | -- | -- | |
| Duncan Sandra K | -- | -- | |
| Duncan Sandra K | -- | -- | |
| Duncan Sandra K | -- | -- | |
| Duncan Sandra K | -- | -- | |
| Duncan Ernest Harold | -- | -- | |
| -- | $35,000 | -- |
Source: Public Records
Mortgage History
| Date | Status | Borrower | Loan Amount |
|---|---|---|---|
| Previous Owner | Duncan Sandra K | $30,000 |
Source: Public Records
Tax History Compared to Growth
Tax History
| Year | Tax Paid | Tax Assessment Tax Assessment Total Assessment is a certain percentage of the fair market value that is determined by local assessors to be the total taxable value of land and additions on the property. | Land | Improvement |
|---|---|---|---|---|
| 2024 | $1,924 | $56,946 | $4,160 | $52,786 |
| 2023 | $1,964 | $43,594 | $2,403 | $41,191 |
| 2022 | $1,737 | $43,594 | $2,403 | $41,191 |
| 2021 | $1,472 | $34,043 | $2,403 | $31,640 |
| 2020 | $1,416 | $32,486 | $2,403 | $30,083 |
| 2019 | $1,333 | $30,151 | $2,403 | $27,748 |
| 2018 | $1,302 | $29,178 | $2,403 | $26,775 |
| 2017 | $1,272 | $29,178 | $2,403 | $26,775 |
| 2016 | $1,272 | $29,178 | $2,403 | $26,775 |
| 2015 | $1,281 | $29,178 | $2,403 | $26,775 |
| 2014 | $1,280 | $29,178 | $2,403 | $26,775 |
| 2013 | -- | $34,774 | $2,402 | $32,371 |
Source: Public Records
Map
Nearby Homes
- 1100 Atlantic Ave
- 903 Atlantic Ave
- 1205 Dean Dr
- 1002 Baltimore Ave
- 1100 Euclid Ave
- 1204 Richmond Ave
- 1009 Euclid Ave
- 907 Euclid Ave
- 713 Magnolia Dr
- 807 City Blvd
- 0 Saint Marys Dr Unit (TRACT 2 0.25 ACRES)
- 1001 Coral Rd
- 707 Euclid Ave
- 808 Satilla Blvd
- 1101 Cherokee Dr
- 1312 Atlantic Ave
- 511 Richmond Ave
- 00 Seminole Trail
- 506 Magnolia Dr
- 706 Cherokee Cir
- 1003 Atlantic Ave
- 911 Atlantic Ave
- 1007 Atlantic Ave
- 1008 Tupelo Dr
- 1004 Richmond Ave
- 909 Atlantic Ave Unit 1
- 909 Atlantic Ave
- 1000 Atlantic Ave
- 910 Atlantic Ave
- 1007 Tupelo Dr
- 1001 Dean Dr
- 1002 Atlantic Ave
- 1003 Dean Dr
- 908 Richmond Ave
- 908 Atlantic Ave
- 0 Richmond Ave Unit 7460993
- 907 Atlantic Ave
- 1006 Atlantic Ave
- 807 809 Atlantic Ave
- 1006 Richmond Ave