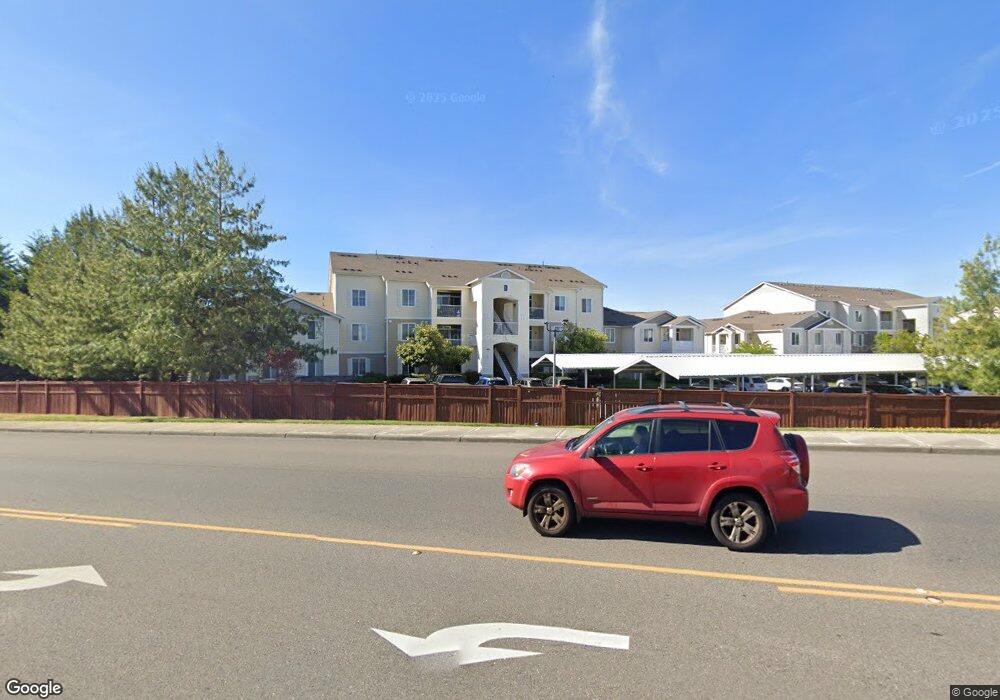
10003 186th St E Unit 120 Puyallup, WA 98375
Estimated Value: $257,000 - $317,000
2
Beds
1
Bath
912
Sq Ft
$324/Sq Ft
Est. Value
About This Home
This home is located at 10003 186th St E Unit 120, Puyallup, WA 98375 and is currently estimated at $295,191, approximately $323 per square foot. 10003 186th St E Unit 120 is a home located in Pierce County with nearby schools including Brouillet Elementary School, Stahl Junior High, and Gov. John Rogers High School.
Ownership History
Date
Name
Owned For
Owner Type
Purchase Details
Closed on
Mar 9, 2010
Sold by
Hsbc Bank Usa National Association
Bought by
Boelling Daniel P
Current Estimated Value
Home Financials for this Owner
Home Financials are based on the most recent Mortgage that was taken out on this home.
Original Mortgage
$96,662
Outstanding Balance
$65,708
Interest Rate
5.5%
Mortgage Type
FHA
Estimated Equity
$229,483
Purchase Details
Closed on
Aug 6, 2009
Sold by
Kramer Dorothy
Bought by
Hsbc Bank Usa National Association
Purchase Details
Closed on
Feb 16, 2005
Sold by
Meridian Partners I Llc
Bought by
Kramer Dorothy
Home Financials for this Owner
Home Financials are based on the most recent Mortgage that was taken out on this home.
Original Mortgage
$122,740
Interest Rate
8.25%
Mortgage Type
Purchase Money Mortgage
Create a Home Valuation Report for This Property
The Home Valuation Report is an in-depth analysis detailing your home's value as well as a comparison with similar homes in the area
Home Values in the Area
Average Home Value in this Area
Purchase History
| Date | Buyer | Sale Price | Title Company |
|---|---|---|---|
| Boelling Daniel P | $103,900 | Fatco | |
| Hsbc Bank Usa National Association | $133,509 | Fatco | |
| Kramer Dorothy | $129,200 | Chicago Title Insurance Co |
Source: Public Records
Mortgage History
| Date | Status | Borrower | Loan Amount |
|---|---|---|---|
| Open | Boelling Daniel P | $96,662 | |
| Previous Owner | Kramer Dorothy | $122,740 |
Source: Public Records
Tax History Compared to Growth
Tax History
| Year | Tax Paid | Tax Assessment Tax Assessment Total Assessment is a certain percentage of the fair market value that is determined by local assessors to be the total taxable value of land and additions on the property. | Land | Improvement |
|---|---|---|---|---|
| 2025 | $3,411 | $283,800 | $37,700 | $246,100 |
| 2024 | $3,411 | $298,800 | $37,700 | $261,100 |
| 2023 | $3,411 | $273,000 | $48,500 | $224,500 |
| 2022 | $3,098 | $273,000 | $48,500 | $224,500 |
| 2021 | $3,244 | $203,400 | $40,400 | $163,000 |
| 2019 | $2,028 | $176,900 | $36,700 | $140,200 |
| 2018 | $1,512 | $147,400 | $30,600 | $116,800 |
| 2017 | $1,248 | $98,700 | $29,300 | $69,400 |
| 2016 | $1,186 | $73,100 | $29,300 | $43,800 |
| 2014 | $1,479 | $69,600 | $29,300 | $40,300 |
| 2013 | $1,479 | $65,200 | $29,300 | $35,900 |
Source: Public Records
Map
Nearby Homes
- 10109 186th St E Unit 244
- 10109 186th St E Unit 249
- 18615 101st Avenue Ct E Unit 161
- 9818 184th St E Unit 47
- 18527 101st Avenue Ct E Unit 217
- 18527 101st Avenue Ct E Unit 313
- 18527 97th Ave E
- 10113 186th St E Unit 257
- 10113 186th St E Unit 154
- 18903 99th Avenue Ct E
- 19017 96th Avenue Ct E Unit 104
- 19206 99th Ave E Unit 48
- 17709 Silver Creek Ave E
- 18919 Eastwood Ave E
- 18702 105th Avenue Ct E
- 18923 Eastwood Ave E
- 19001 Eastwood Ave E
- 9409 190th St E
- 18737 105th Avenue Ct E
- 9721 194th St E
- 10003 186th St E Unit 326
- 10003 186th St E Unit 325
- 10003 186th St E Unit 322
- 10003 186th St E Unit 321
- 10003 186th St E Unit 227
- 10003 186th St E Unit 226
- 10003 186th St E Unit 225
- 10003 186th St E Unit 224
- 10003 186th St E Unit 223
- 10003 186th St E Unit 222
- 10003 186th St E Unit 221
- 10003 186th St E Unit 220
- 10003 186th St E Unit 127
- 10003 186th St E Unit 126
- 10003 186th St E Unit 125
- 10003 186th St E Unit 124
- 10003 186th St E Unit 123
- 10003 186th St E Unit 122
- 10003 186th St E Unit 121
- 10003 186th St E