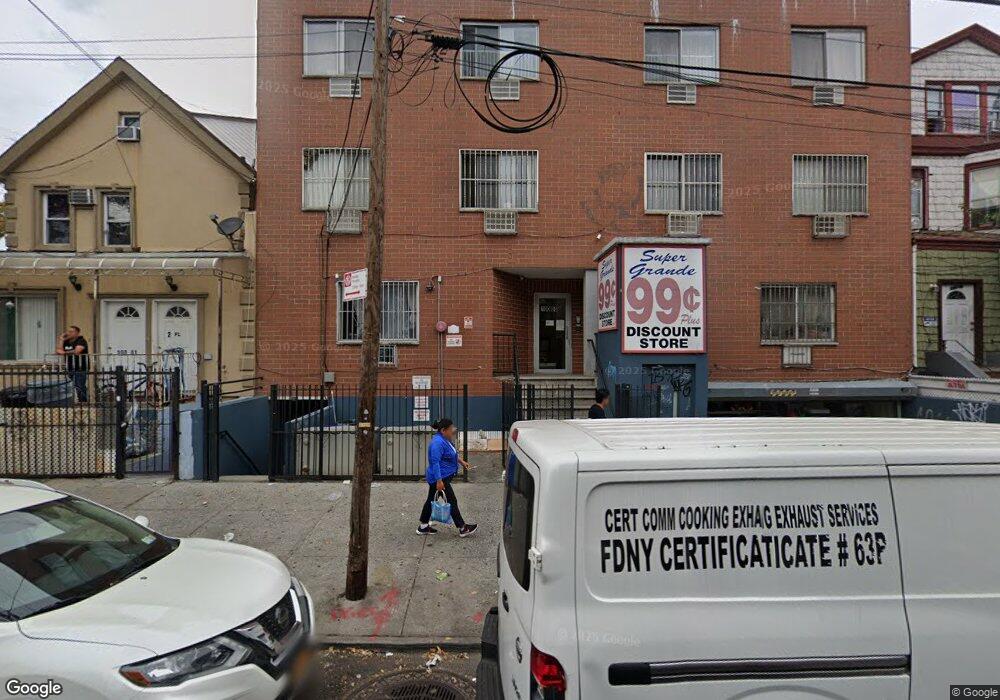
10005 37th Ave Unit 2A Corona, NY 11368
Corona NeighborhoodEstimated Value: $408,000 - $489,000
--
Bed
--
Bath
770
Sq Ft
$586/Sq Ft
Est. Value
About This Home
This home is located at 10005 37th Ave Unit 2A, Corona, NY 11368 and is currently estimated at $451,428, approximately $586 per square foot. 10005 37th Ave Unit 2A is a home located in Queens County with nearby schools including Pioneer Academy, Corona Arts And Sciences Academy, and Newtown High School.
Ownership History
Date
Name
Owned For
Owner Type
Purchase Details
Closed on
May 11, 2023
Sold by
Zou Meiling
Bought by
Chen Cun Ying and Liu Yanqin
Current Estimated Value
Home Financials for this Owner
Home Financials are based on the most recent Mortgage that was taken out on this home.
Original Mortgage
$219,000
Outstanding Balance
$212,776
Interest Rate
6.27%
Mortgage Type
Purchase Money Mortgage
Estimated Equity
$238,652
Purchase Details
Closed on
Apr 30, 2018
Sold by
Tam Chun Keung and Tam Wai Chun
Bought by
Zou Meiling
Purchase Details
Closed on
Jan 10, 2017
Sold by
Li Tang Ping and Li Wen Shu
Bought by
Tam Chun Keung and Tam Wai Chun
Purchase Details
Closed on
Jan 8, 2008
Sold by
99-27 Realty Llc
Bought by
Li Tang Ping and Li Wen Shu
Home Financials for this Owner
Home Financials are based on the most recent Mortgage that was taken out on this home.
Original Mortgage
$100,000
Interest Rate
6.17%
Mortgage Type
Purchase Money Mortgage
Create a Home Valuation Report for This Property
The Home Valuation Report is an in-depth analysis detailing your home's value as well as a comparison with similar homes in the area
Home Values in the Area
Average Home Value in this Area
Purchase History
| Date | Buyer | Sale Price | Title Company |
|---|---|---|---|
| Chen Cun Ying | $438,000 | -- | |
| Zou Meiling | $418,000 | -- | |
| Tam Chun Keung | $418,000 | -- | |
| Li Tang Ping | $275,000 | -- | |
| Li Tang Ping | $275,000 | -- |
Source: Public Records
Mortgage History
| Date | Status | Borrower | Loan Amount |
|---|---|---|---|
| Open | Chen Cun Ying | $219,000 | |
| Previous Owner | Li Tang Ping | $100,000 |
Source: Public Records
Tax History Compared to Growth
Tax History
| Year | Tax Paid | Tax Assessment Tax Assessment Total Assessment is a certain percentage of the fair market value that is determined by local assessors to be the total taxable value of land and additions on the property. | Land | Improvement |
|---|---|---|---|---|
| 2025 | $199 | $37,114 | $7,257 | $29,857 |
| 2024 | $199 | $39,279 | $7,257 | $32,022 |
| 2023 | $199 | $34,146 | $7,257 | $26,889 |
| 2022 | $194 | $33,663 | $7,257 | $26,406 |
| 2021 | $195 | $33,070 | $7,257 | $25,813 |
| 2020 | $197 | $38,343 | $7,257 | $31,086 |
| 2019 | $199 | $38,517 | $7,257 | $31,260 |
| 2018 | $3,961 | $31,410 | $7,256 | $24,154 |
| 2016 | $205 | $26,500 | $7,257 | $19,243 |
| 2015 | $160 | $25,727 | $7,257 | $18,470 |
| 2014 | $160 | $26,995 | $7,257 | $19,738 |
Source: Public Records
Map
Nearby Homes
- 100-05 37th Ave Unit 4FL
- 3722 101st St
- 101-19 37th Ave
- 37-33 100th St
- 37-44 102nd St
- 3758 100th St
- 3763 99th St
- 37-30 103rd St Unit 2B
- 37-30 103rd St Unit 2E
- 37-30 103rd St Unit D3
- 3730 103rd St Unit 2
- 3730 103rd St Unit G2
- 35-44 104th St
- 35-38 104th St
- 3418 103rd St
- 35-36 97th St Unit 1st
- 100-09 39th Ave Unit 2F
- 37-13 104th St
- 100-17 39th Ave
- 96-16 35th Ave
- 10005 37th Ave Unit 4B
- 10005 37th Ave Unit 4A
- 10005 37th Ave Unit 3C
- 10005 37th Ave Unit 3B
- 10005 37th Ave Unit 3A
- 10005 37th Ave Unit 2C
- 10005 37th Ave Unit 2B
- 10005 37th Ave Unit 1B
- 10005 37th Ave Unit 1A
- 10005 37th Ave Unit CA
- 10005 37th Ave
- 100-05 37th Ave Unit 2B
- 100-05 37th Ave Unit 4B
- 100-05 37th Ave Unit 2A
- 100-05 37th Ave
- 100-05 37th Ave Unit 1A
- 100-05 37th Ave Unit 3B
- 100-07 37th Ave
- 3551 100th St
- 10009 37th Ave