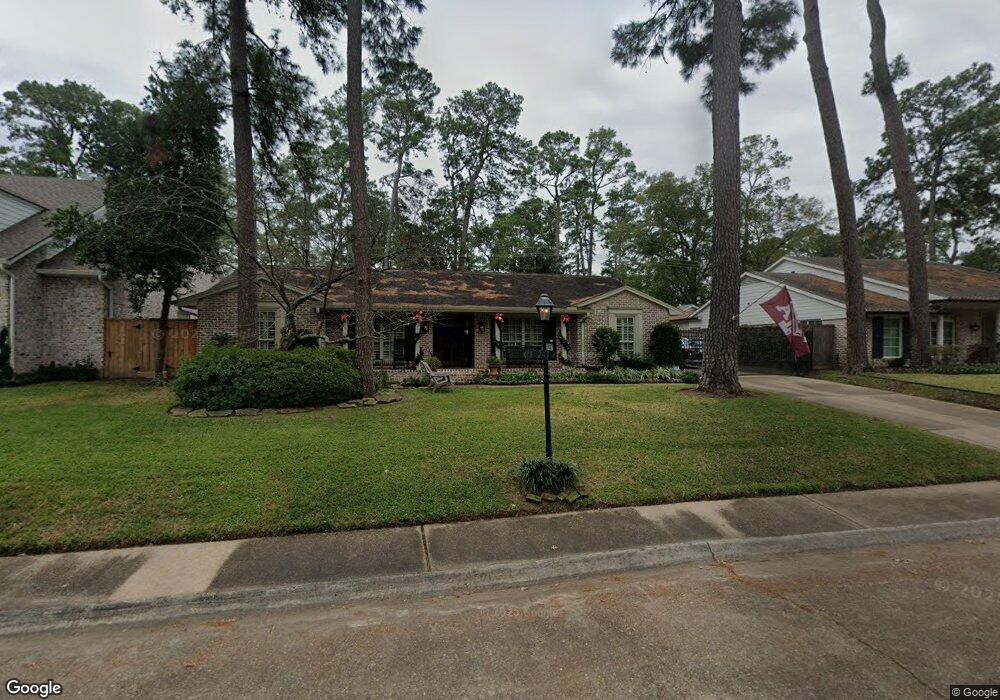
10007 Pine Forest Rd Houston, TX 77042
Briar Forest NeighborhoodEstimated Value: $837,000 - $1,050,869
3
Beds
3
Baths
2,360
Sq Ft
$406/Sq Ft
Est. Value
About This Home
This home is located at 10007 Pine Forest Rd, Houston, TX 77042 and is currently estimated at $958,467, approximately $406 per square foot. 10007 Pine Forest Rd is a home located in Harris County with nearby schools including Walnut Bend Elementary School, Paul Revere Middle School, and Westside High School.
Ownership History
Date
Name
Owned For
Owner Type
Purchase Details
Closed on
Jun 22, 2012
Sold by
Mckenty John S and Mckenty Beverly A
Bought by
Jackson John G and Jackson Audrey E
Current Estimated Value
Home Financials for this Owner
Home Financials are based on the most recent Mortgage that was taken out on this home.
Original Mortgage
$310,000
Interest Rate
2.87%
Mortgage Type
Adjustable Rate Mortgage/ARM
Purchase Details
Closed on
Aug 9, 2005
Sold by
Catherine M Lippincott Trust
Bought by
Mckenty John S and Mckenty Beverly A
Home Financials for this Owner
Home Financials are based on the most recent Mortgage that was taken out on this home.
Original Mortgage
$192,000
Interest Rate
5.51%
Mortgage Type
Fannie Mae Freddie Mac
Purchase Details
Closed on
Jan 2, 2001
Sold by
Lippincott Thomas M
Bought by
Catherine M Lippincott Trust
Create a Home Valuation Report for This Property
The Home Valuation Report is an in-depth analysis detailing your home's value as well as a comparison with similar homes in the area
Home Values in the Area
Average Home Value in this Area
Purchase History
| Date | Buyer | Sale Price | Title Company |
|---|---|---|---|
| Jackson John G | -- | None Available | |
| Mckenty John S | -- | Ameripoint Title | |
| Catherine M Lippincott Trust | -- | -- |
Source: Public Records
Mortgage History
| Date | Status | Borrower | Loan Amount |
|---|---|---|---|
| Closed | Jackson John G | $310,000 | |
| Previous Owner | Mckenty John S | $192,000 |
Source: Public Records
Tax History Compared to Growth
Tax History
| Year | Tax Paid | Tax Assessment Tax Assessment Total Assessment is a certain percentage of the fair market value that is determined by local assessors to be the total taxable value of land and additions on the property. | Land | Improvement |
|---|---|---|---|---|
| 2025 | $8,246 | $903,390 | $444,083 | $459,307 |
| 2024 | $8,246 | $877,077 | $444,083 | $432,994 |
| 2023 | $8,246 | $849,365 | $444,083 | $405,282 |
| 2022 | $15,817 | $817,203 | $444,083 | $373,120 |
| 2021 | $15,220 | $653,031 | $444,083 | $208,948 |
| 2020 | $15,837 | $653,973 | $444,083 | $209,890 |
| 2019 | $16,979 | $683,600 | $444,083 | $239,517 |
| 2018 | $9,601 | $610,000 | $236,844 | $373,156 |
| 2017 | $16,560 | $654,928 | $236,844 | $418,084 |
| 2016 | $17,548 | $694,000 | $236,844 | $457,156 |
| 2015 | $10,193 | $778,000 | $236,844 | $541,156 |
| 2014 | $10,193 | $641,054 | $236,844 | $404,210 |
Source: Public Records
Map
Nearby Homes
- 10010 Bordley Dr
- 10034 Bordley Dr
- 8 Woodstone St
- 1 Woodstone St
- 10 Warrenton Dr
- 150 Gessner Rd Unit 5A
- 3 Plantation Rd
- 0 Gessner Rd
- 10121 Valley Forge Dr
- 170 Haversham Dr
- 201 Vanderpool Ln Unit 103
- 201 Vanderpool Ln Unit 65
- 201 Vanderpool Ln Unit 64
- 10323 Pine Forest Rd
- 12327 Tunbridge Ln
- 10212 Longmont Dr Unit 44/7
- 241 Litchfield Ln
- 246 Litchfield Ln
- 238 Litchfield Ln
- 201 Litchfield Ln
- 10011 Pine Forest Rd
- 10003 Pine Forest Rd
- 10006 Candlewood Dr
- 10010 Candlewood Dr
- 10002 Candlewood Dr
- 10015 Pine Forest Rd
- 10006 Pine Forest Rd
- 10018 Candlewood Dr
- 10010 Pine Forest Rd
- 10002 Pine Forest Rd
- 10019 Pine Forest Rd
- 10018 Pine Forest Rd
- 507 Briarpark Dr
- 10022 Candlewood Dr
- 503 Briarpark Dr
- 511 Briarpark Dr
- 10007 Candlewood Dr
- 515 Briarpark Dr
- 10011 Candlewood Dr
- 10007 Green Tree Rd