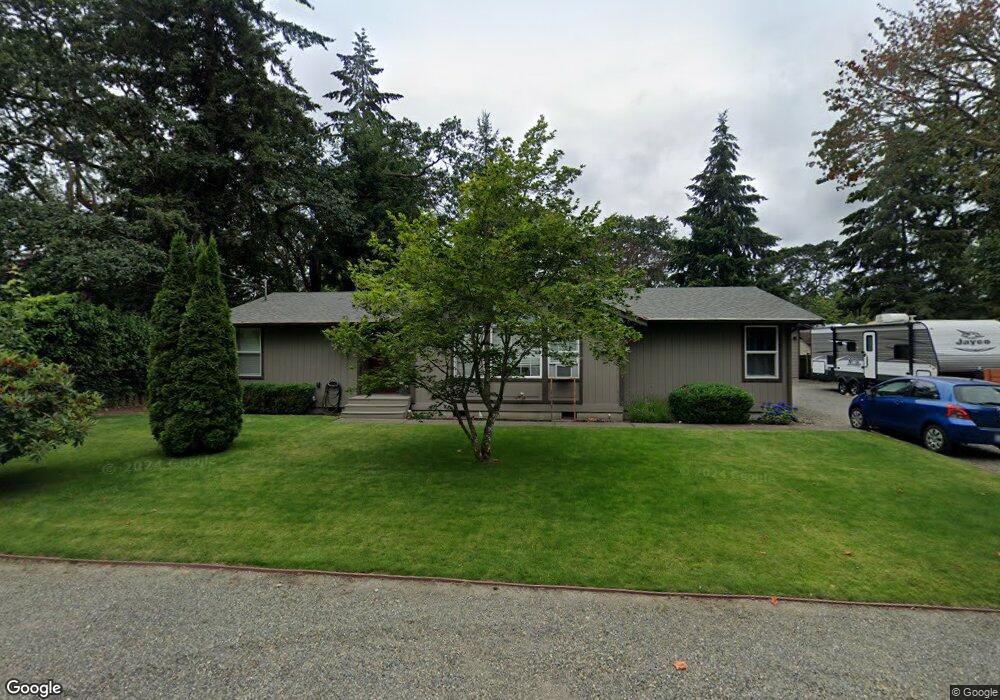
10008 Oak Ln SW Lakewood, WA 98499
Lakeview NeighborhoodEstimated Value: $481,000 - $583,000
3
Beds
2
Baths
1,500
Sq Ft
$355/Sq Ft
Est. Value
About This Home
This home is located at 10008 Oak Ln SW, Lakewood, WA 98499 and is currently estimated at $531,832, approximately $354 per square foot. 10008 Oak Ln SW is a home located in Pierce County with nearby schools including Park Lodge Elementary School, Hudtloff Middle School, and Clover Park High School.
Ownership History
Date
Name
Owned For
Owner Type
Purchase Details
Closed on
Jul 26, 2022
Sold by
Butler Michael D and Butler Johnna L
Bought by
Michael And Johnna Butler Living Trust
Current Estimated Value
Purchase Details
Closed on
Nov 1, 2006
Sold by
Blanton Dickie M
Bought by
Butler Michael D and Butler Johnna L
Home Financials for this Owner
Home Financials are based on the most recent Mortgage that was taken out on this home.
Original Mortgage
$178,000
Interest Rate
2%
Mortgage Type
Purchase Money Mortgage
Purchase Details
Closed on
Nov 7, 2002
Sold by
Blanton Dickie M
Bought by
Blanton Dickie M
Purchase Details
Closed on
Oct 19, 1999
Sold by
Riegelman Jeanne B
Bought by
Stewart Dann J
Home Financials for this Owner
Home Financials are based on the most recent Mortgage that was taken out on this home.
Original Mortgage
$103,200
Interest Rate
7.86%
Purchase Details
Closed on
Jan 13, 1946
Sold by
Mcconaghy John S
Bought by
Kneip Phillip A and Kneip Alice M
Create a Home Valuation Report for This Property
The Home Valuation Report is an in-depth analysis detailing your home's value as well as a comparison with similar homes in the area
Home Values in the Area
Average Home Value in this Area
Purchase History
| Date | Buyer | Sale Price | Title Company |
|---|---|---|---|
| Michael And Johnna Butler Living Trust | -- | None Listed On Document | |
| Butler Michael D | $222,500 | First American Title Ins Co | |
| Blanton Dickie M | -- | -- | |
| Stewart Dann J | $150,078 | Rainier Title Company | |
| Kneip Phillip A | -- | -- |
Source: Public Records
Mortgage History
| Date | Status | Borrower | Loan Amount |
|---|---|---|---|
| Previous Owner | Butler Michael D | $178,000 | |
| Previous Owner | Stewart Dann J | $103,200 |
Source: Public Records
Tax History Compared to Growth
Tax History
| Year | Tax Paid | Tax Assessment Tax Assessment Total Assessment is a certain percentage of the fair market value that is determined by local assessors to be the total taxable value of land and additions on the property. | Land | Improvement |
|---|---|---|---|---|
| 2025 | $5,224 | $519,900 | $234,700 | $285,200 |
| 2024 | $5,224 | $514,500 | $230,100 | $284,400 |
| 2023 | $5,224 | $463,300 | $214,400 | $248,900 |
| 2022 | $4,418 | $486,200 | $230,200 | $256,000 |
| 2021 | $4,140 | $317,200 | $143,900 | $173,300 |
| 2019 | $3,166 | $287,000 | $123,800 | $163,200 |
| 2018 | $3,414 | $263,400 | $105,800 | $157,600 |
| 2017 | $3,325 | $230,600 | $82,200 | $148,400 |
| 2016 | $2,765 | $190,400 | $59,300 | $131,100 |
| 2014 | $2,469 | $173,300 | $51,700 | $121,600 |
| 2013 | $2,469 | $154,900 | $41,800 | $113,100 |
Source: Public Records
Map
Nearby Homes
- 6405 Avondale Rd SW
- 10213 Green Ln SW
- 10325 Whitman Ave SW
- 9612 Oak Ln SW
- 10415 Whitman Ave SW
- 6716 Mount Tacoma Dr SW
- 6810 Mount Tacoma Dr SW
- 6902 Mount Tacoma Dr SW
- 6424 Montclair Ave SW Unit 6B
- 6423 Motor Ave SW Unit 3
- 6405 Montclair Ave SW
- 9349 Dekoven Dr SW
- 10826 Meadow Rd SW
- 9302 Dekoven Dr SW
- 9144 Edgewater Dr SW
- 6355 111th St SW
- 6501 Ardmore Dr SW
- 6539 Ardmore Dr SW
- 11202 Greystone Dr SW Unit 1A
- 6514 Steilacoom Blvd SW
- 10002 Oak Ln SW
- 10020 Oak Ln SW
- 6614 100th St SW
- 10015 Oak Ln SW
- 10007 Meadow Rd SW
- 10015 Meadow Rd SW
- 10024 Oak Ln SW
- 6522 100th St SW
- 10019 Meadow Rd SW
- 10019 Oak Ln SW
- 9920 Oak Ln SW
- 10021 Meadow Rd SW
- 10025 Oak Ln SW
- 6615 100th St SW
- 6605 Alfaretta St SW
- 6521 100th St SW
- 6615 Alfaretta St SW
- 9839 Meadow Rd SW
- 6517 100th St SW
- 9908 Oak Ln SW