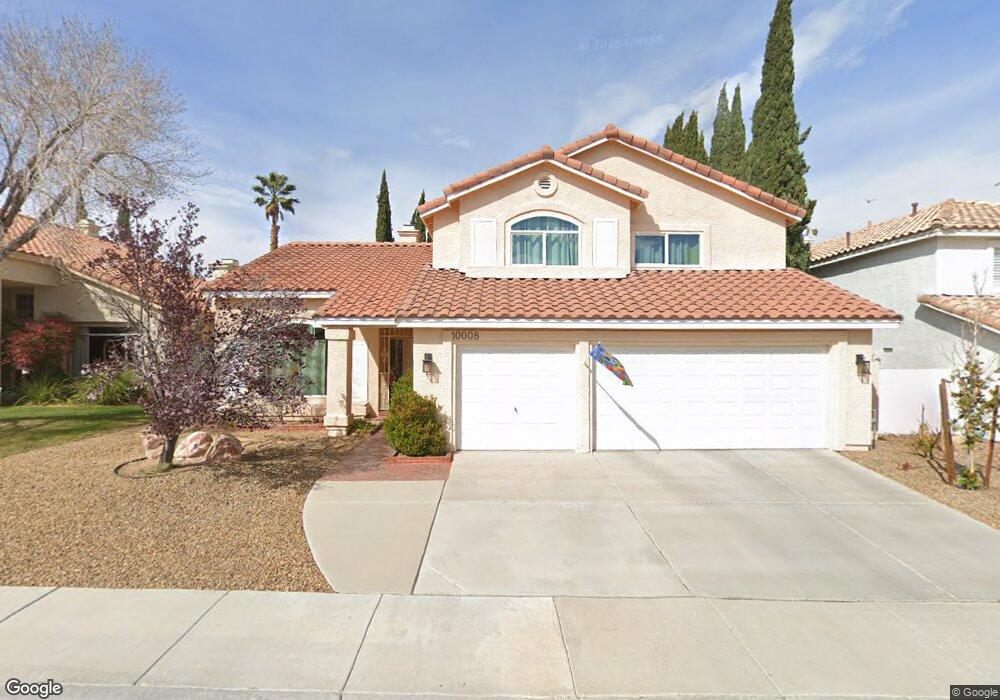
10008 Sail Landing Ct Unit 3 Las Vegas, NV 89117
The Section Seven NeighborhoodEstimated Value: $630,775 - $684,000
3
Beds
3
Baths
2,593
Sq Ft
$255/Sq Ft
Est. Value
About This Home
This home is located at 10008 Sail Landing Ct Unit 3, Las Vegas, NV 89117 and is currently estimated at $660,194, approximately $254 per square foot. 10008 Sail Landing Ct Unit 3 is a home located in Clark County with nearby schools including D'Vorre & Hal Ober Elementary School, Victoria Fertitta Middle School, and Bonanza High School.
Ownership History
Date
Name
Owned For
Owner Type
Purchase Details
Closed on
Nov 26, 2024
Sold by
Hawley Ben
Bought by
Ben Hawley Trust and Hawley
Current Estimated Value
Purchase Details
Closed on
Dec 2, 2002
Sold by
Hawley Ben
Bought by
Hawley Ben
Home Financials for this Owner
Home Financials are based on the most recent Mortgage that was taken out on this home.
Original Mortgage
$173,800
Interest Rate
6.28%
Purchase Details
Closed on
Jul 11, 2000
Sold by
Hawley Lorraine
Bought by
Hawley Ben
Purchase Details
Closed on
Nov 27, 1995
Sold by
Young Elsie M
Bought by
Hawley Ben and Hawley Lorraine
Home Financials for this Owner
Home Financials are based on the most recent Mortgage that was taken out on this home.
Original Mortgage
$180,940
Interest Rate
7.42%
Purchase Details
Closed on
Jul 5, 1995
Sold by
Vitale Cynthia M
Bought by
Young Elsie M
Create a Home Valuation Report for This Property
The Home Valuation Report is an in-depth analysis detailing your home's value as well as a comparison with similar homes in the area
Home Values in the Area
Average Home Value in this Area
Purchase History
| Date | Buyer | Sale Price | Title Company |
|---|---|---|---|
| Ben Hawley Trust | -- | None Listed On Document | |
| Hawley Ben | $173,500 | Lawyers Title | |
| Hawley Ben | -- | -- | |
| Hawley Ben | $195,000 | United Title | |
| Young Elsie M | $202,500 | First American Title Co |
Source: Public Records
Mortgage History
| Date | Status | Borrower | Loan Amount |
|---|---|---|---|
| Previous Owner | Hawley Ben | $173,800 | |
| Previous Owner | Hawley Ben | $180,940 |
Source: Public Records
Tax History Compared to Growth
Tax History
| Year | Tax Paid | Tax Assessment Tax Assessment Total Assessment is a certain percentage of the fair market value that is determined by local assessors to be the total taxable value of land and additions on the property. | Land | Improvement |
|---|---|---|---|---|
| 2025 | $3,132 | $139,791 | $53,550 | $86,241 |
| 2024 | $3,041 | $139,791 | $53,550 | $86,241 |
| 2023 | $3,041 | $132,302 | $49,700 | $82,602 |
| 2022 | $2,953 | $114,146 | $37,800 | $76,346 |
| 2021 | $2,867 | $110,884 | $37,800 | $73,084 |
| 2020 | $2,781 | $110,692 | $37,800 | $72,892 |
| 2019 | $2,700 | $102,377 | $30,100 | $72,277 |
| 2018 | $2,621 | $99,472 | $29,400 | $70,072 |
| 2017 | $3,210 | $97,919 | $26,250 | $71,669 |
| 2016 | $2,482 | $93,070 | $21,000 | $72,070 |
| 2015 | $2,477 | $77,872 | $16,800 | $61,072 |
| 2014 | $2,404 | $71,161 | $12,250 | $58,911 |
Source: Public Records
Map
Nearby Homes
- 10028 Sail Landing Ct
- 10025 Harpoon Cir
- 10024 Rolling Glen Ct
- 3026 Cherum St
- 10191 Refuge Ct Unit 2
- 9917 Aspen Knoll Ct
- 9836 Russett Wood Cir
- 9833 Dardanelle Ct
- 10291 Songsparrow Ct
- 2909 Ivory Reef Ct
- 9905 Fox Springs Dr
- 10281 Rarity Ave
- 3275 Phantom Rock St
- 9820 Cross Creek Way
- 9717 Sierra Mesa Ave
- 2821 Willow Wind Ct
- 3001 Bridge Creek St
- 9741 Horizon Hills Dr
- 10068 Yellow Canary Ave
- 9724 Cascade Falls Ave
- 10012 Sail Landing Ct
- 10000 Sail Landing Ct
- 10005 Harpoon Cir
- 10016 Sail Landing Ct
- 10001 Harpoon Cir
- 10009 Harpoon Cir
- 10013 Harpoon Cir
- 10009 Sail Landing Ct
- 10013 Sail Landing Ct
- 10020 Sail Landing Ct
- 10005 Sail Landing Ct
- 10017 Sail Landing Ct
- 10017 Harpoon Cir
- 10001 Sail Landing Ct
- 3108 Pearl Harbor Dr
- 3108 Pearl Harbor Dr Unit None
- 3104 Pearl Harbor Dr
- 10024 Sail Landing Ct
- 10021 Sail Landing Ct
- 9941 Tamarack Landing Way