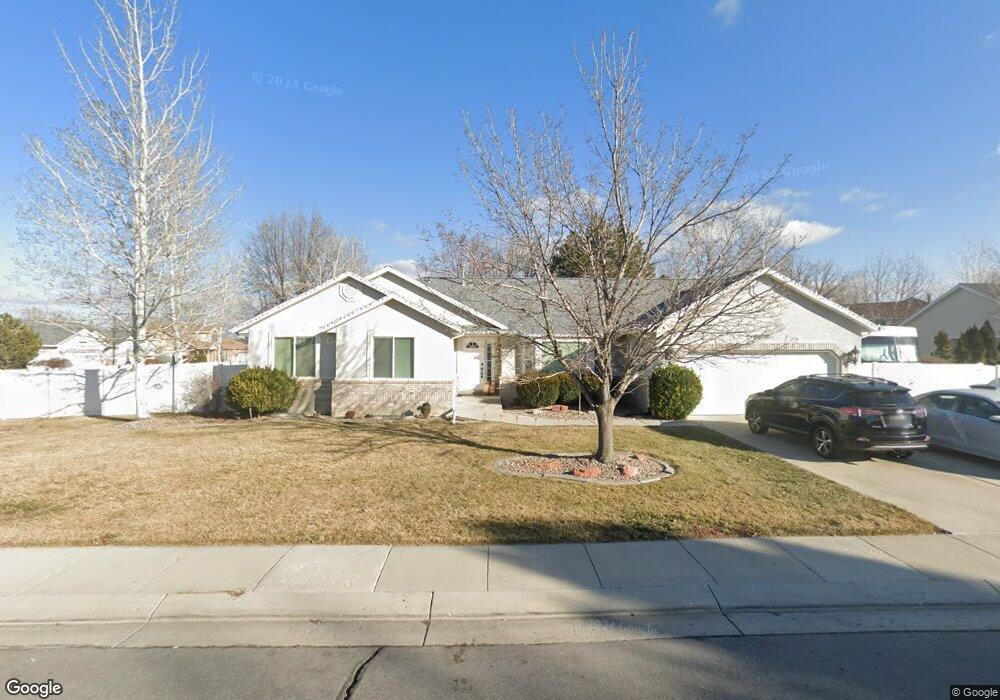
10009 S Jordan Crest Cir South Jordan, UT 84095
Estimated Value: $828,000 - $963,000
3
Beds
3
Baths
4,746
Sq Ft
$182/Sq Ft
Est. Value
About This Home
This home is located at 10009 S Jordan Crest Cir, South Jordan, UT 84095 and is currently estimated at $866,073, approximately $182 per square foot. 10009 S Jordan Crest Cir is a home located in Salt Lake County with nearby schools including Jordan Ridge School, South Jordan Middle School, and Hawthorn Academy.
Ownership History
Date
Name
Owned For
Owner Type
Purchase Details
Closed on
Jan 5, 2021
Sold by
Romero Ricky and Mismash Neil
Bought by
Romero Ricky and Romero Brenda
Current Estimated Value
Home Financials for this Owner
Home Financials are based on the most recent Mortgage that was taken out on this home.
Original Mortgage
$535,500
Outstanding Balance
$477,852
Interest Rate
2.7%
Mortgage Type
New Conventional
Estimated Equity
$388,221
Purchase Details
Closed on
Jan 4, 2021
Sold by
Batchelor Gary and Batchelor Mary
Bought by
Romero Ricky and Mismash Neil
Home Financials for this Owner
Home Financials are based on the most recent Mortgage that was taken out on this home.
Original Mortgage
$535,500
Outstanding Balance
$477,852
Interest Rate
2.7%
Mortgage Type
New Conventional
Estimated Equity
$388,221
Purchase Details
Closed on
May 1, 2008
Sold by
Golding Linda
Bought by
Batchelor Gary and Batchelor Mary
Home Financials for this Owner
Home Financials are based on the most recent Mortgage that was taken out on this home.
Original Mortgage
$65,985
Interest Rate
5.88%
Mortgage Type
Credit Line Revolving
Purchase Details
Closed on
May 16, 2006
Sold by
Cooper Gary J
Bought by
Golding Linda
Home Financials for this Owner
Home Financials are based on the most recent Mortgage that was taken out on this home.
Original Mortgage
$75,600
Interest Rate
6.09%
Mortgage Type
Stand Alone Second
Purchase Details
Closed on
Apr 20, 2006
Sold by
Olsen Kenneth R and Olsen Rebecca
Bought by
Cooper Gary J
Home Financials for this Owner
Home Financials are based on the most recent Mortgage that was taken out on this home.
Original Mortgage
$75,600
Interest Rate
6.09%
Mortgage Type
Stand Alone Second
Purchase Details
Closed on
Sep 9, 1998
Sold by
Ferrante Michael R
Bought by
Olsen Kenneth R and Olsen Rebecca
Home Financials for this Owner
Home Financials are based on the most recent Mortgage that was taken out on this home.
Original Mortgage
$177,600
Interest Rate
6.92%
Purchase Details
Closed on
May 9, 1995
Sold by
Ferrante Michael R and Nielsen Misty
Bought by
Ferrante Michael R
Home Financials for this Owner
Home Financials are based on the most recent Mortgage that was taken out on this home.
Original Mortgage
$130,000
Interest Rate
8.05%
Purchase Details
Closed on
Jun 24, 1994
Sold by
Ferrante Michael R
Bought by
Ferante Michael R and Nielsen Misty
Home Financials for this Owner
Home Financials are based on the most recent Mortgage that was taken out on this home.
Original Mortgage
$138,632
Interest Rate
8.83%
Create a Home Valuation Report for This Property
The Home Valuation Report is an in-depth analysis detailing your home's value as well as a comparison with similar homes in the area
Home Values in the Area
Average Home Value in this Area
Purchase History
| Date | Buyer | Sale Price | Title Company |
|---|---|---|---|
| Romero Ricky | -- | Accommodation | |
| Romero Ricky | -- | Inwest Title Srvs Slc | |
| Batchelor Gary | -- | Title One | |
| Golding Linda | -- | Title One | |
| Cooper Gary J | -- | Title One | |
| Olsen Kenneth R | -- | -- | |
| Ferrante Michael R | -- | -- | |
| Ferante Michael R | -- | -- |
Source: Public Records
Mortgage History
| Date | Status | Borrower | Loan Amount |
|---|---|---|---|
| Open | Romero Ricky | $535,500 | |
| Previous Owner | Batchelor Gary | $65,985 | |
| Previous Owner | Batchelor Gary | $351,920 | |
| Previous Owner | Golding Linda | $75,600 | |
| Previous Owner | Golding Linda | $302,400 | |
| Previous Owner | Cooper Gary J | $302,250 | |
| Previous Owner | Olsen Kenneth R | $177,600 | |
| Previous Owner | Ferrante Michael R | $130,000 | |
| Previous Owner | Ferante Michael R | $138,632 |
Source: Public Records
Tax History Compared to Growth
Tax History
| Year | Tax Paid | Tax Assessment Tax Assessment Total Assessment is a certain percentage of the fair market value that is determined by local assessors to be the total taxable value of land and additions on the property. | Land | Improvement |
|---|---|---|---|---|
| 2025 | $3,967 | $801,800 | $199,800 | $602,000 |
| 2024 | $3,967 | $753,300 | $185,400 | $567,900 |
| 2023 | $4,077 | $730,300 | $180,100 | $550,200 |
| 2022 | $4,230 | $742,700 | $176,600 | $566,100 |
| 2021 | $3,223 | $519,200 | $134,800 | $384,400 |
| 2020 | $3,138 | $473,900 | $130,500 | $343,400 |
| 2019 | $3,114 | $462,200 | $130,500 | $331,700 |
| 2018 | $2,918 | $431,000 | $130,500 | $300,500 |
| 2017 | $2,827 | $409,200 | $106,800 | $302,400 |
| 2016 | $2,835 | $388,900 | $106,800 | $282,100 |
| 2015 | $2,843 | $379,100 | $108,800 | $270,300 |
| 2014 | $2,645 | $346,700 | $100,600 | $246,100 |
Source: Public Records
Map
Nearby Homes
- 1578 W Banner Dr Unit 745
- 1558 W Banner Dr Unit 805
- 1574 W Banner Dr Unit 743
- 1556 W Banner Dr Unit 806
- 1548 W Banner Dr Unit 809
- 1552 W Banner Dr Unit 807
- 1553 W Banner Dr Unit 844
- 10177 Statesman Place
- 10339 S Cold Moon Place
- 3312 W Harvest Grove Way
- 10320 S 2700 W
- 2551 W Winding Way
- 3274 W Harvest Chase Dr
- 10489 S Harvest Glory Dr
- 3211 W Harvest Glory Dr
- 2439 Bridle Oak Dr
- 10252 S 3570 W
- 3256 Star Fire Rd
- 2375 Bonanza Way
- 3651 W 10200 S Unit 11
- 10009 Jordan Crest Cir
- 3038 Capitol Place
- 10035 Jordan Crest Cir
- 10008 Jordan Crest Cir
- 3028 Capitol Place
- 3066 W 10000 S
- 10034 Jordan Crest Cir
- 3084 W 10000 S
- 3037 W Capitol Place
- 3037 Capitol Place
- 3046 W 10000 S
- 10047 Jordan Crest Cir
- 3102 W 10000 S
- 10013 Jordan Park Cir
- 3022 W 10000 S
- 10046 Jordan Crest Cir
- 3023 Capitol Place
- 3023 W Capitol Place
- 10033 Jordan Park Cir
- 3012 Capitol Place