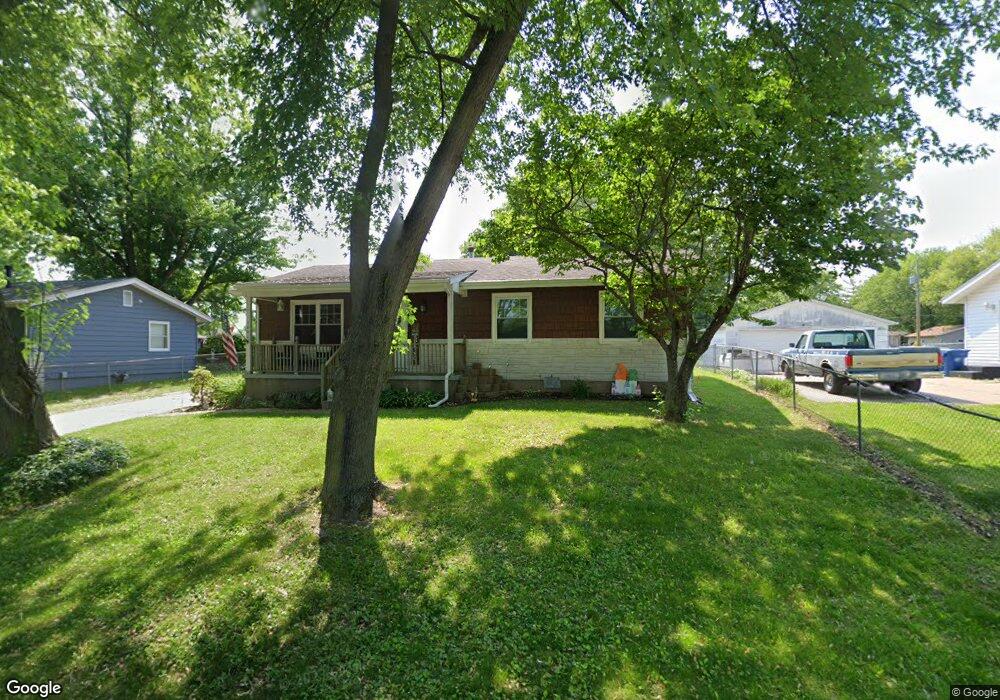
1001 15th St Port Byron, IL 61275
Estimated Value: $173,000 - $216,000
--
Bed
--
Bath
1,008
Sq Ft
$186/Sq Ft
Est. Value
About This Home
This home is located at 1001 15th St, Port Byron, IL 61275 and is currently estimated at $187,110, approximately $185 per square foot. 1001 15th St is a home with nearby schools including Riverdale Elementary School, Riverdale Middle School, and Riverdale Senior High School.
Ownership History
Date
Name
Owned For
Owner Type
Purchase Details
Closed on
Sep 14, 2020
Sold by
Johnson Nicholas J and Johnson Meghan L
Bought by
Horton Scott L and Heydeman Alissa
Current Estimated Value
Home Financials for this Owner
Home Financials are based on the most recent Mortgage that was taken out on this home.
Original Mortgage
$134,518
Interest Rate
3.13%
Mortgage Type
FHA
Create a Home Valuation Report for This Property
The Home Valuation Report is an in-depth analysis detailing your home's value as well as a comparison with similar homes in the area
Home Values in the Area
Average Home Value in this Area
Purchase History
| Date | Buyer | Sale Price | Title Company |
|---|---|---|---|
| Horton Scott L | $137,000 | Brooks Law Firm Pc |
Source: Public Records
Mortgage History
| Date | Status | Borrower | Loan Amount |
|---|---|---|---|
| Previous Owner | Horton Scott L | $134,518 | |
| Closed | Horton Scott L | $5,480 |
Source: Public Records
Tax History Compared to Growth
Tax History
| Year | Tax Paid | Tax Assessment Tax Assessment Total Assessment is a certain percentage of the fair market value that is determined by local assessors to be the total taxable value of land and additions on the property. | Land | Improvement |
|---|---|---|---|---|
| 2024 | $3,593 | $53,971 | $11,791 | $42,180 |
| 2023 | $3,593 | $50,582 | $11,051 | $39,531 |
| 2022 | $3,868 | $50,392 | $10,750 | $39,642 |
| 2021 | $3,838 | $48,176 | $10,277 | $37,899 |
| 2020 | $3,312 | $47,558 | $10,145 | $37,413 |
| 2019 | $3,257 | $46,694 | $9,961 | $36,733 |
| 2018 | $2,902 | $42,956 | $7,524 | $35,432 |
| 2017 | $2,800 | $42,155 | $7,384 | $34,771 |
| 2016 | $2,793 | $41,945 | $7,347 | $34,598 |
| 2015 | $2,755 | $41,123 | $7,203 | $33,920 |
| 2014 | $139 | $40,093 | $7,023 | $33,070 |
| 2013 | $139 | $40,093 | $7,023 | $33,070 |
Source: Public Records
Map
Nearby Homes