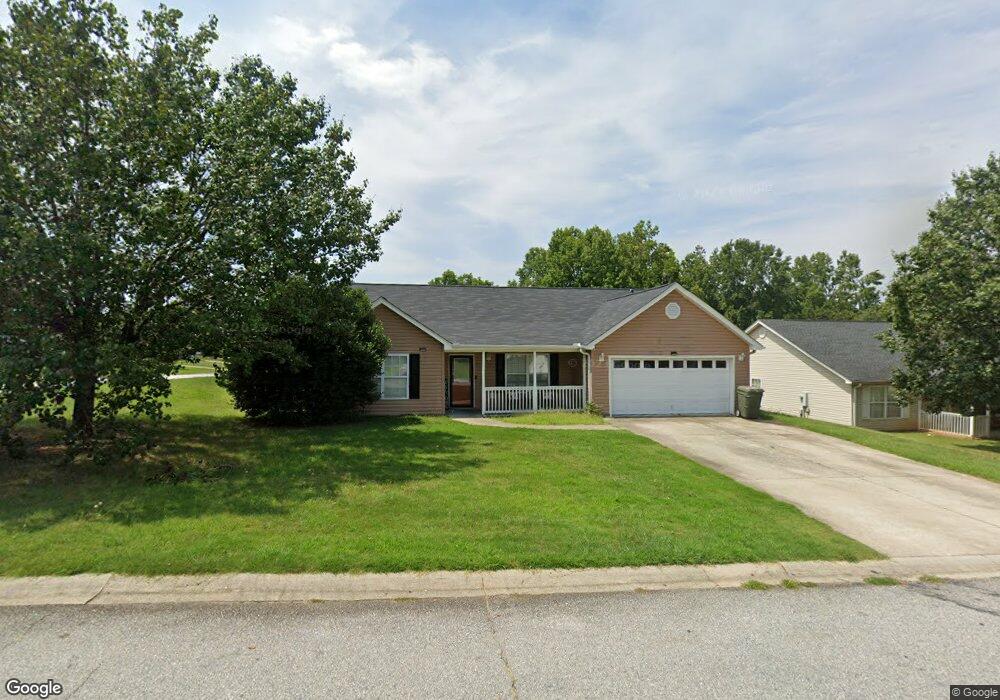
1001 Autumn Leaf Ln Fountain Inn, SC 29644
Estimated Value: $269,000 - $308,000
3
Beds
2
Baths
1,891
Sq Ft
$152/Sq Ft
Est. Value
About This Home
This home is located at 1001 Autumn Leaf Ln, Fountain Inn, SC 29644 and is currently estimated at $287,146, approximately $151 per square foot. 1001 Autumn Leaf Ln is a home located in Greenville County with nearby schools including Bryson Elementary School, Bryson Middle School, and Fountain Inn Christian School.
Ownership History
Date
Name
Owned For
Owner Type
Purchase Details
Closed on
Feb 15, 2011
Sold by
Hills Side Properties Llc
Bought by
Dunbar Apryleranda L
Current Estimated Value
Home Financials for this Owner
Home Financials are based on the most recent Mortgage that was taken out on this home.
Original Mortgage
$122,279
Outstanding Balance
$83,593
Interest Rate
4.76%
Mortgage Type
New Conventional
Estimated Equity
$203,553
Purchase Details
Closed on
Jun 15, 2010
Sold by
Grantham Christopher C
Bought by
Hills Side Properties Llc
Purchase Details
Closed on
Nov 11, 2004
Sold by
Chase Manhattan Mortgage Corpo
Bought by
Grantham Christopher C
Purchase Details
Closed on
Jul 28, 2004
Sold by
Mattison Michael J
Bought by
Chase Manhattan Mortgage Corpo
Purchase Details
Closed on
Oct 6, 1999
Sold by
Seppala Homes Inc
Bought by
Mattison Michael J
Create a Home Valuation Report for This Property
The Home Valuation Report is an in-depth analysis detailing your home's value as well as a comparison with similar homes in the area
Home Values in the Area
Average Home Value in this Area
Purchase History
| Date | Buyer | Sale Price | Title Company |
|---|---|---|---|
| Dunbar Apryleranda L | $118,000 | -- | |
| Hills Side Properties Llc | $71,500 | -- | |
| Grantham Christopher C | $99,500 | -- | |
| Chase Manhattan Mortgage Corpo | $2,500 | -- | |
| Mattison Michael J | $107,150 | -- |
Source: Public Records
Mortgage History
| Date | Status | Borrower | Loan Amount |
|---|---|---|---|
| Open | Dunbar Apryleranda L | $122,279 |
Source: Public Records
Tax History Compared to Growth
Tax History
| Year | Tax Paid | Tax Assessment Tax Assessment Total Assessment is a certain percentage of the fair market value that is determined by local assessors to be the total taxable value of land and additions on the property. | Land | Improvement |
|---|---|---|---|---|
| 2024 | $1,165 | $5,170 | $830 | $4,340 |
| 2023 | $1,165 | $5,170 | $830 | $4,340 |
| 2022 | $1,141 | $5,170 | $830 | $4,340 |
| 2021 | $1,130 | $5,170 | $830 | $4,340 |
| 2020 | $1,076 | $4,490 | $720 | $3,770 |
| 2019 | $1,077 | $4,490 | $720 | $3,770 |
| 2018 | $1,075 | $4,490 | $720 | $3,770 |
| 2017 | $945 | $4,490 | $720 | $3,770 |
| 2016 | $909 | $112,360 | $18,000 | $94,360 |
| 2015 | $909 | $112,360 | $18,000 | $94,360 |
| 2014 | $948 | $120,250 | $18,000 | $102,250 |
Source: Public Records
Map
Nearby Homes
- 102 Sagewood Ct
- 19 Kendals Ln
- 109 Blue Ridge Dr
- 628 Hellams St
- 118 Sylvester St
- 119A Woodland Dr
- 300 Stockland Trail
- 501 Fountain Brook Ln
- 416 Scarlet Oak Dr
- 8 Single Oak Ct
- 203 Addlestone Cir
- 25 Trailwood Dr
- 100 Belmont Dr
- 139 Hughes St
- 105 Belmont Dr
- 201A Belmont Dr
- Salem Plan at Durbin Meadows - Traditions
- Sanford Plan at Durbin Meadows
- Brandon Plan at Durbin Meadows
- Darwin Plan at Durbin Meadows
- 1003 Autumn Leaf Ln
- 301 Grape Arbor Ln
- 206 Grape Arbor Ln
- 1002 Autumn Leaf Ln
- 207 Grape Arbor Ln
- 303 Grape Arbor Ln
- 304 Grape Arbor Ln
- 1005 Autumn Leaf Ln
- 1004 Autumn Leaf Ln
- 204 Grape Arbor Ln
- 205 Grape Arbor Ln
- 305 Grape Arbor Ln
- 408 Ariel Ct
- 1006 Autumn Leaf Ln
- 807 Veryfine Dr
- 203 Grape Arbor Ln
- 1007 Autumn Leaf Ln
- 535 Climbing Rose Ct
- 202 Grape Arbor Ln
- 531 Climbing Rose Ct