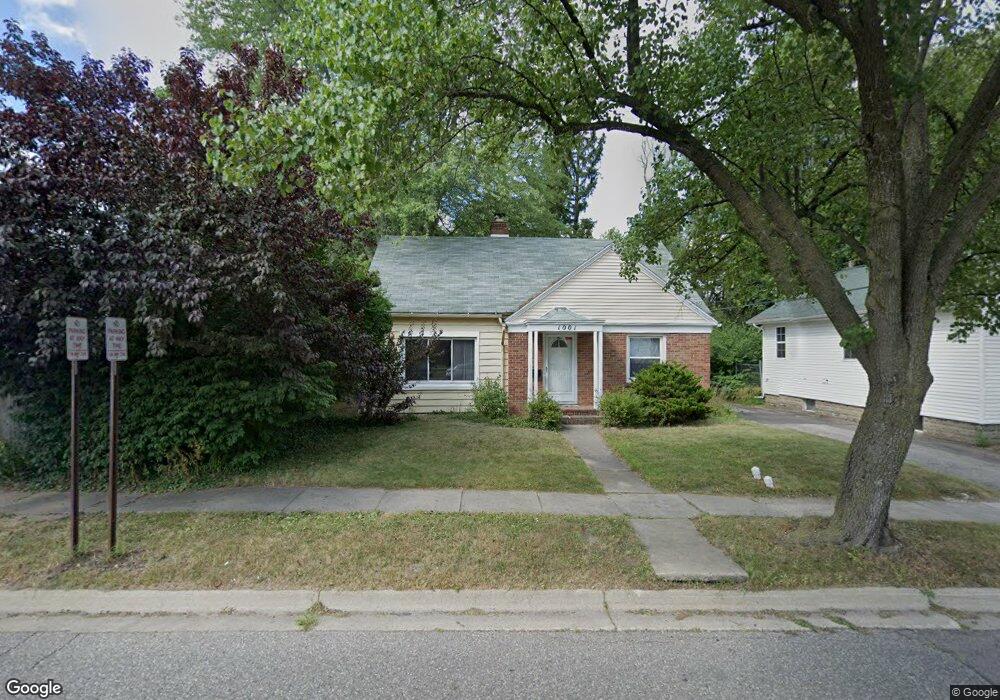
1001 E Albert Avevue Update, MI 48823
Estimated Value: $259,286 - $301,000
4
Beds
2
Baths
1,376
Sq Ft
$201/Sq Ft
Est. Value
About This Home
This home is located at 1001 E Albert Avevue, Update, MI 48823 and is currently estimated at $277,072, approximately $201 per square foot. 1001 E Albert Avevue is a home located in Ingham County with nearby schools including Marble Elementary School, MacDonald Middle School, and East Lansing High School.
Ownership History
Date
Name
Owned For
Owner Type
Purchase Details
Closed on
Apr 14, 2015
Sold by
Collins Richard and Collins Donna
Bought by
Gong Dao Rong and Gong Regina H
Current Estimated Value
Home Financials for this Owner
Home Financials are based on the most recent Mortgage that was taken out on this home.
Original Mortgage
$121,600
Outstanding Balance
$93,983
Interest Rate
3.85%
Mortgage Type
New Conventional
Estimated Equity
$183,089
Purchase Details
Closed on
Feb 22, 2012
Sold by
Macpherson Lorne M and Kral Ivianne
Bought by
Collins Richard and Collins Riley
Purchase Details
Closed on
Jun 4, 2007
Sold by
Macpherson Robert A
Bought by
Macpherson Lome M and Kral Ivianne
Home Financials for this Owner
Home Financials are based on the most recent Mortgage that was taken out on this home.
Original Mortgage
$104,000
Interest Rate
6.21%
Mortgage Type
Purchase Money Mortgage
Purchase Details
Closed on
Jun 1, 1975
Create a Home Valuation Report for This Property
The Home Valuation Report is an in-depth analysis detailing your home's value as well as a comparison with similar homes in the area
Home Values in the Area
Average Home Value in this Area
Purchase History
| Date | Buyer | Sale Price | Title Company |
|---|---|---|---|
| Gong Dao Rong | $152,000 | Parks Title | |
| Collins Richard | $136,000 | Parks Title | |
| Macpherson Lome M | $130,000 | Toleno Title Inc | |
| -- | $27,800 | -- |
Source: Public Records
Mortgage History
| Date | Status | Borrower | Loan Amount |
|---|---|---|---|
| Open | Gong Dao Rong | $121,600 | |
| Previous Owner | Macpherson Lome M | $104,000 |
Source: Public Records
Tax History Compared to Growth
Tax History
| Year | Tax Paid | Tax Assessment Tax Assessment Total Assessment is a certain percentage of the fair market value that is determined by local assessors to be the total taxable value of land and additions on the property. | Land | Improvement |
|---|---|---|---|---|
| 2025 | $6,822 | $103,900 | $19,800 | $84,100 |
| 2024 | -- | $99,500 | $18,300 | $81,200 |
| 2023 | $6,402 | $92,400 | $16,200 | $76,200 |
| 2022 | $6,039 | $83,100 | $14,700 | $68,400 |
| 2021 | $6,039 | $81,000 | $13,000 | $68,000 |
| 2020 | $6,225 | $83,900 | $13,300 | $70,600 |
| 2019 | $6,004 | $83,900 | $15,100 | $68,800 |
| 2018 | $6,389 | $81,500 | $14,400 | $67,100 |
| 2017 | $6,164 | $79,100 | $16,300 | $62,800 |
| 2016 | -- | $77,500 | $16,200 | $61,300 |
| 2015 | -- | $72,500 | $31,328 | $41,172 |
| 2014 | -- | $69,000 | $31,104 | $37,896 |
Source: Public Records
Map
Nearby Homes
- 15403 Short St
- 704 Beech St
- 696 Beech St
- 1124 Burcham Dr
- 353 Division St
- 586 Lexington Ave
- 1550 Ann St
- 220 Mac Ave Unit 302
- 235 Maplewood Dr
- 933 Bedford Rd
- 688 Moorland Dr Unit 9
- 408 Whitehills Dr
- 753 E Saginaw St
- 351 Oakhill Ave Unit 207
- 1719 Woodside Dr
- 1544 Haslett Rd
- 904 Sunset Ln
- 415 W Grand River Ave
- 815 Westlawn Ave
- 1351 Foxcroft Rd