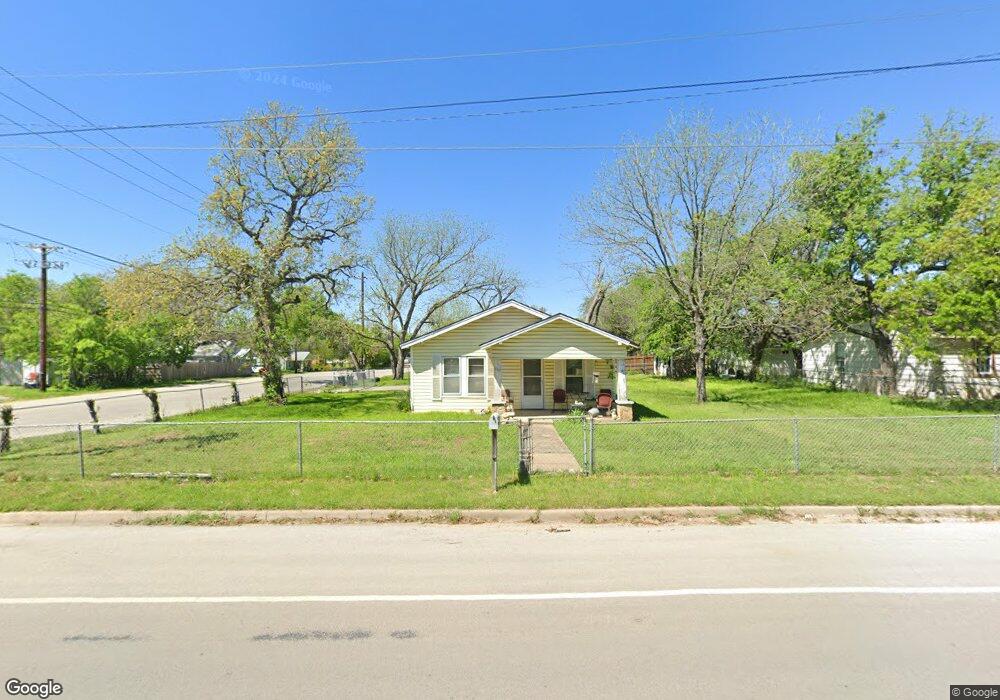
1001 Franklin St Weatherford, TX 76086
Estimated Value: $187,747 - $237,000
--
Bed
--
Bath
1,032
Sq Ft
$206/Sq Ft
Est. Value
About This Home
This home is located at 1001 Franklin St, Weatherford, TX 76086 and is currently estimated at $212,437, approximately $205 per square foot. 1001 Franklin St is a home located in Parker County with nearby schools including Seguin Elementary School, Tison Middle School, and Weatherford High School.
Ownership History
Date
Name
Owned For
Owner Type
Purchase Details
Closed on
Nov 15, 2016
Sold by
Beauchamp George
Bought by
Vanya Shelley Beuachamp
Current Estimated Value
Purchase Details
Closed on
Jul 27, 2016
Sold by
Fuller Meleta Christine Beauchamp
Bought by
Vanya Shelley Beauchamp
Purchase Details
Closed on
Sep 24, 2003
Sold by
Smith Gregory S and Smith Kristi
Bought by
Vanya Shelley Beuachamp
Purchase Details
Closed on
Jun 4, 1999
Sold by
Mills Nelda L
Bought by
Vanya Shelley Beuachamp
Purchase Details
Closed on
May 19, 1999
Sold by
Moore H F
Bought by
Vanya Shelley Beuachamp
Create a Home Valuation Report for This Property
The Home Valuation Report is an in-depth analysis detailing your home's value as well as a comparison with similar homes in the area
Home Values in the Area
Average Home Value in this Area
Purchase History
| Date | Buyer | Sale Price | Title Company |
|---|---|---|---|
| Vanya Shelley Beuachamp | -- | -- | |
| Vanya Shelley Beauchamp | -- | None Available | |
| Vanya Shelley Beauchamp | -- | None Available | |
| Vanya Shelley Beuachamp | -- | -- | |
| Vanya Shelley Beuachamp | -- | -- | |
| Vanya Shelley Beuachamp | -- | -- |
Source: Public Records
Tax History Compared to Growth
Tax History
| Year | Tax Paid | Tax Assessment Tax Assessment Total Assessment is a certain percentage of the fair market value that is determined by local assessors to be the total taxable value of land and additions on the property. | Land | Improvement |
|---|---|---|---|---|
| 2025 | $630 | $123,529 | -- | -- |
| 2024 | $630 | $112,299 | -- | -- |
| 2023 | $630 | $102,090 | $0 | $0 |
| 2022 | $2,059 | $92,810 | $15,000 | $77,810 |
| 2021 | $2,088 | $92,810 | $15,000 | $77,810 |
| 2020 | $1,910 | $79,030 | $15,000 | $64,030 |
| 2019 | $1,970 | $79,030 | $15,000 | $64,030 |
| 2018 | $1,799 | $70,150 | $15,000 | $55,150 |
| 2017 | $1,846 | $70,150 | $15,000 | $55,150 |
| 2016 | $1,578 | $59,970 | $15,000 | $44,970 |
| 2015 | $1,545 | $59,970 | $15,000 | $44,970 |
| 2014 | $1,382 | $55,020 | $15,000 | $40,020 |
Source: Public Records
Map
Nearby Homes