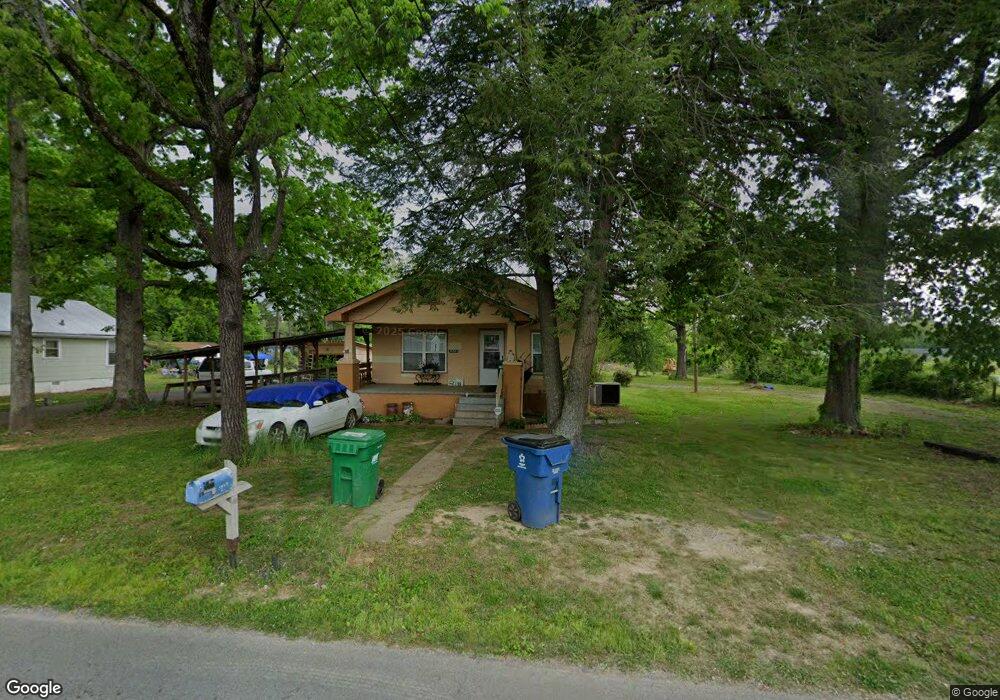
1001 Glentana Rd Rossville, GA 30741
Estimated Value: $70,000 - $156,000
2
Beds
1
Bath
1,244
Sq Ft
$88/Sq Ft
Est. Value
About This Home
This home is located at 1001 Glentana Rd, Rossville, GA 30741 and is currently estimated at $109,265, approximately $87 per square foot. 1001 Glentana Rd is a home located in Walker County with nearby schools including Rossville Elementary School, Rossville Middle School, and Ridgeland High School.
Ownership History
Date
Name
Owned For
Owner Type
Purchase Details
Closed on
Nov 9, 2023
Sold by
Pettigrew Kenneth
Bought by
Bailey Remonda and Bailey Danny
Current Estimated Value
Home Financials for this Owner
Home Financials are based on the most recent Mortgage that was taken out on this home.
Original Mortgage
$80,000
Outstanding Balance
$77,185
Interest Rate
7.49%
Mortgage Type
New Conventional
Estimated Equity
$32,080
Purchase Details
Closed on
Sep 3, 2013
Sold by
Nobles Sharon
Bought by
Pettigrew Kenneth
Purchase Details
Closed on
Apr 23, 1999
Sold by
Hayes Marie
Bought by
Chitty Sharon and Bill Chitty
Purchase Details
Closed on
Aug 26, 1997
Sold by
Shankle Mary Jo H
Bought by
Hayes Marie
Purchase Details
Closed on
May 3, 1995
Sold by
Hamlet David Margaret and Hamlet Mar
Bought by
Shankle Mary Jo H
Purchase Details
Closed on
Dec 8, 1994
Sold by
Hamlet David M and Hamlet Margaret
Bought by
Hamlet David Margaret and Hamlet Mar
Purchase Details
Closed on
Jan 1, 1972
Bought by
Hamlet David M and Hamlet Margaret
Create a Home Valuation Report for This Property
The Home Valuation Report is an in-depth analysis detailing your home's value as well as a comparison with similar homes in the area
Home Values in the Area
Average Home Value in this Area
Purchase History
| Date | Buyer | Sale Price | Title Company |
|---|---|---|---|
| Bailey Remonda | $80,000 | -- | |
| Pettigrew Kenneth | $35,200 | -- | |
| Chitty Sharon | -- | -- | |
| Hayes Marie | $55,000 | -- | |
| Shankle Mary Jo H | -- | -- | |
| Hamlet David Margaret | -- | -- | |
| Hamlet David M | -- | -- |
Source: Public Records
Mortgage History
| Date | Status | Borrower | Loan Amount |
|---|---|---|---|
| Open | Bailey Remonda | $80,000 |
Source: Public Records
Tax History Compared to Growth
Tax History
| Year | Tax Paid | Tax Assessment Tax Assessment Total Assessment is a certain percentage of the fair market value that is determined by local assessors to be the total taxable value of land and additions on the property. | Land | Improvement |
|---|---|---|---|---|
| 2024 | $187 | $9,227 | $9,227 | $0 |
| 2023 | $1,256 | $52,235 | $9,480 | $42,755 |
| 2022 | $1,084 | $41,303 | $4,740 | $36,563 |
| 2021 | $873 | $29,111 | $4,740 | $24,371 |
| 2020 | $789 | $24,919 | $4,740 | $20,179 |
| 2019 | $818 | $25,473 | $4,740 | $20,733 |
| 2018 | $674 | $25,473 | $4,740 | $20,733 |
| 2017 | $887 | $25,473 | $4,740 | $20,733 |
| 2016 | $610 | $19,621 | $4,740 | $14,881 |
| 2015 | $725 | $22,844 | $4,724 | $18,120 |
| 2014 | $420 | $22,791 | $4,724 | $18,067 |
| 2013 | -- | $26,129 | $4,724 | $21,405 |
Source: Public Records
Map
Nearby Homes
- 53 Charlsie Trail Unit 12
- 1014 Wilson Rd
- 635 N Sherry Dr
- 816 Indian Ave
- 601 James St
- 715 W James St
- 1014 Lee Ave
- 717 W James St
- 527 W Gordon Ave
- 200 W Oak St
- 126 S Liner St
- 916 Logan Ave
- 509 W Gordon Ave
- 610 Union Ave
- 724 Shelly Ln
- 5220 Fagan St
- 1410 E 50th St
- 806 Mcfarland Ave
- 105 Elm St
- 1403 E 49th St
- 1007 Glentana Rd
- 1003 Glentana Rd
- 1000 Glentana Rd
- 1005 Glentana Rd
- 42 Charlsie Trail Unit 5
- 42 Charlsie Trail Unit 5
- 966 Glentana Rd
- 1010 Glentana Rd
- 998 Glentana Rd
- 1004 Ridgewood St
- 1012 Glentana Rd
- 53 Charlsie Trail Unit 12
- 700 S Mohawk St
- 634 S Mohawk St
- 1104 Ridgewood St
- 1100 Glentana Rd
- 505 Mohawk St
- 702 S Mohawk St
- 13 Charlsie Trail Unit 8
- 13 Charlsie Trail Unit 8