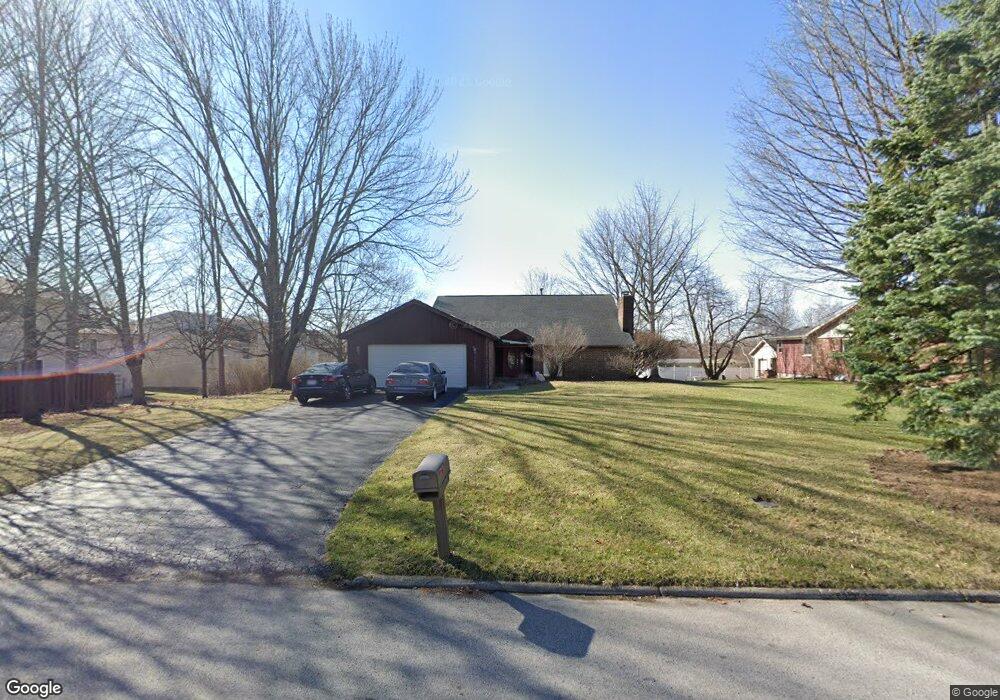
1001 Inverness Dr Findlay, OH 45840
Estimated Value: $289,310 - $338,000
4
Beds
2
Baths
1,502
Sq Ft
$204/Sq Ft
Est. Value
About This Home
This home is located at 1001 Inverness Dr, Findlay, OH 45840 and is currently estimated at $306,578, approximately $204 per square foot. 1001 Inverness Dr is a home located in Hancock County with nearby schools including Liberty-Benton Elementary School, Liberty-Benton Middle School, and Liberty-Benton High School.
Ownership History
Date
Name
Owned For
Owner Type
Purchase Details
Closed on
Jun 6, 2007
Sold by
Chen Buo and Qi Jia
Bought by
Daulton Jesse L and Kuhl Sara M
Current Estimated Value
Home Financials for this Owner
Home Financials are based on the most recent Mortgage that was taken out on this home.
Original Mortgage
$154,900
Outstanding Balance
$94,885
Interest Rate
6.21%
Mortgage Type
Purchase Money Mortgage
Estimated Equity
$211,693
Purchase Details
Closed on
Sep 1, 1999
Sold by
Clement Kenneth
Bought by
Chen Buo and Chen Jia Qi
Home Financials for this Owner
Home Financials are based on the most recent Mortgage that was taken out on this home.
Original Mortgage
$120,350
Interest Rate
7.5%
Mortgage Type
New Conventional
Purchase Details
Closed on
Jun 8, 1993
Bought by
Stevens Alan W and Stevens Caroline
Purchase Details
Closed on
Feb 28, 1986
Bought by
Channels Steven A and Channels Tammi
Purchase Details
Closed on
Jan 6, 1986
Bought by
Equitable Relocation
Create a Home Valuation Report for This Property
The Home Valuation Report is an in-depth analysis detailing your home's value as well as a comparison with similar homes in the area
Home Values in the Area
Average Home Value in this Area
Purchase History
| Date | Buyer | Sale Price | Title Company |
|---|---|---|---|
| Daulton Jesse L | $154,900 | Hancock Title Agency | |
| Chen Buo | $126,700 | -- | |
| Stevens Alan W | $117,900 | -- | |
| Channels Steven A | $84,000 | -- | |
| Equitable Relocation | $87,000 | -- |
Source: Public Records
Mortgage History
| Date | Status | Borrower | Loan Amount |
|---|---|---|---|
| Open | Daulton Jesse L | $154,900 | |
| Previous Owner | Chen Buo | $120,350 |
Source: Public Records
Tax History Compared to Growth
Tax History
| Year | Tax Paid | Tax Assessment Tax Assessment Total Assessment is a certain percentage of the fair market value that is determined by local assessors to be the total taxable value of land and additions on the property. | Land | Improvement |
|---|---|---|---|---|
| 2024 | $2,933 | $78,910 | $10,480 | $68,430 |
| 2023 | $2,864 | $78,910 | $10,480 | $68,430 |
| 2022 | $2,836 | $78,910 | $10,480 | $68,430 |
| 2021 | $2,627 | $64,510 | $10,480 | $54,030 |
| 2020 | $2,649 | $64,510 | $10,480 | $54,030 |
| 2019 | $2,541 | $64,510 | $10,480 | $54,030 |
| 2018 | $2,002 | $56,090 | $9,110 | $46,980 |
| 2017 | $1,033 | $56,090 | $9,110 | $46,980 |
| 2016 | $2,009 | $56,090 | $9,110 | $46,980 |
| 2015 | $2,052 | $56,040 | $9,110 | $46,930 |
| 2014 | $2,071 | $56,040 | $9,110 | $46,930 |
| 2012 | $2,163 | $56,040 | $9,110 | $46,930 |
Source: Public Records
Map
Nearby Homes
- 933 Laurel Ln
- 1310 Muirfield Dr
- 3018 Gleneagle Dr
- 3106 Saddlebrook
- 1405 Cypress Lake
- 615 Hillcrest Ave
- 925 W Melrose Ave
- 905 W Melrose Ave
- 506 Hillcrest Ave
- 3300 Crosshill Dr
- 6535 Silver Lake Dr
- 643 Edith Ave
- 126 Hillcrest Ave
- 0 County Road 95 Unit 6097574
- 0 Township Highway 99
- 12325 Township Highway 99
- 304 Prentiss Ave
- 304 Rector Ave
- 232 Prentiss Ave
- 128 Harrington Ave
- 1007 Inverness Dr
- 1000 W Bigelow Ave
- 1006 W Bigelow Ave
- 1015 Inverness Dr
- 1000 Inverness Dr
- 1012 W Bigelow Ave
- 955 W Heatherview Ct
- 955 W Heatherview Ct
- 1006 Inverness Dr
- 2811 Saint Andrews Dr
- 1020 Inverness Dr
- 2805 Saint Andrews Dr
- 1001 W Bigelow Ave
- 2907 Saint Andrews Dr
- 2730 Northridge Rd
- 1101 Inverness Dr
- 2915 Saint Andrews Dr
- 1100 W Bigelow Ave
- 2720 Northridge Rd
- 1102 Inverness Dr