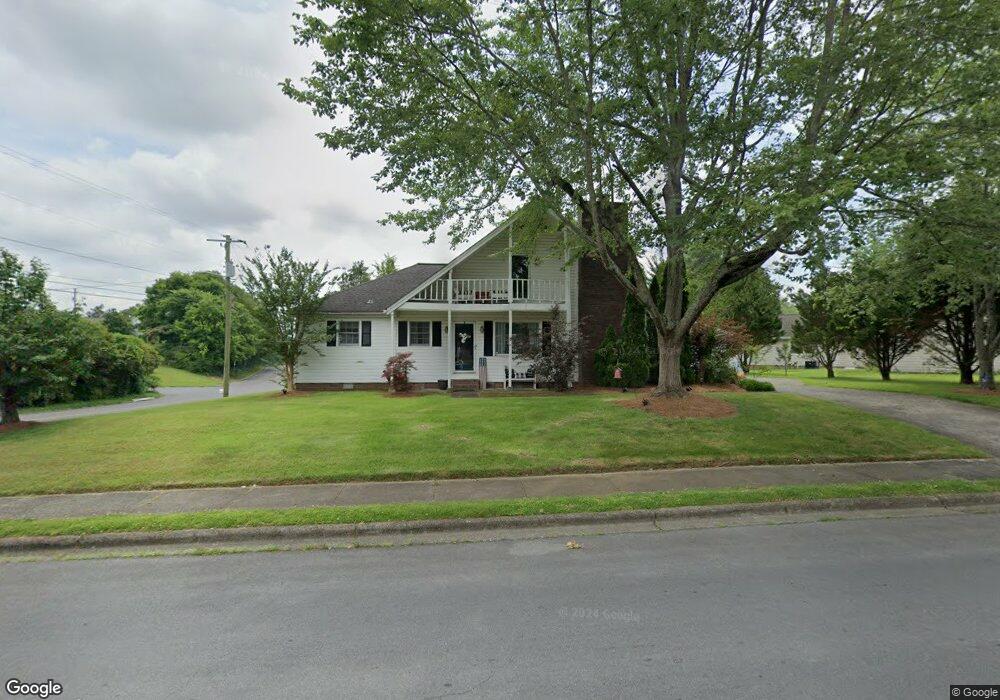
1001 Manly St Dalton, GA 30720
Estimated Value: $296,601 - $349,000
3
Beds
2
Baths
1,500
Sq Ft
$216/Sq Ft
Est. Value
About This Home
This home is located at 1001 Manly St, Dalton, GA 30720 and is currently estimated at $323,650, approximately $215 per square foot. 1001 Manly St is a home located in Whitfield County with nearby schools including Westwood Elementary School, Dalton Middle School, and Dalton High School.
Ownership History
Date
Name
Owned For
Owner Type
Purchase Details
Closed on
Jun 5, 2018
Sold by
Hill Marvin
Bought by
Planzer Iva
Current Estimated Value
Purchase Details
Closed on
Jan 5, 2009
Sold by
J J Industries Inc
Bought by
Planzer Lowell
Purchase Details
Closed on
Dec 31, 2008
Sold by
Planzer Greg
Bought by
J J Industries Inc
Purchase Details
Closed on
Sep 26, 2007
Sold by
Jordan Bruce Alan
Bought by
Planzer Greg and Planzer Pat
Purchase Details
Closed on
Oct 1, 1998
Bought by
Jordan Bruce Alan
Create a Home Valuation Report for This Property
The Home Valuation Report is an in-depth analysis detailing your home's value as well as a comparison with similar homes in the area
Home Values in the Area
Average Home Value in this Area
Purchase History
| Date | Buyer | Sale Price | Title Company |
|---|---|---|---|
| Planzer Iva | $123,115 | -- | |
| Planzer Lowell | -- | -- | |
| J J Industries Inc | $151,373 | -- | |
| Planzer Greg | $146,000 | -- | |
| Jordan Bruce Alan | -- | -- |
Source: Public Records
Tax History Compared to Growth
Tax History
| Year | Tax Paid | Tax Assessment Tax Assessment Total Assessment is a certain percentage of the fair market value that is determined by local assessors to be the total taxable value of land and additions on the property. | Land | Improvement |
|---|---|---|---|---|
| 2024 | $2,825 | $121,457 | $8,000 | $113,457 |
| 2023 | $2,825 | $76,640 | $8,100 | $68,540 |
| 2022 | $2,203 | $63,966 | $5,670 | $58,296 |
| 2021 | $2,206 | $63,966 | $5,670 | $58,296 |
| 2020 | $2,292 | $63,966 | $5,670 | $58,296 |
| 2019 | $1,925 | $52,096 | $5,670 | $46,426 |
| 2018 | $1,578 | $50,058 | $5,670 | $44,388 |
| 2017 | $1,513 | $50,058 | $5,670 | $44,388 |
| 2016 | $1,294 | $43,824 | $3,308 | $40,516 |
| 2014 | $1,380 | $41,813 | $3,150 | $38,663 |
| 2013 | -- | $41,813 | $3,150 | $38,663 |
Source: Public Records
Map
Nearby Homes
- 1001 Manley St
- 1000 Manley St
- 813 Clark St
- 1003 Manley St
- 902 Clark St
- 1000 Manly St
- 811 Clark St
- 321 W Boundary St Unit 321
- 809 Clark St
- 904 Clark St
- 0 Clark St
- 905 Clark St
- 603 W Boundary St
- 502 W Boundary St
- 804 W Waugh St
- 900 W Waugh St
- 906 Clark St
- 504 W Boundary St
- 605 W Boundary St
- 907 Clark St