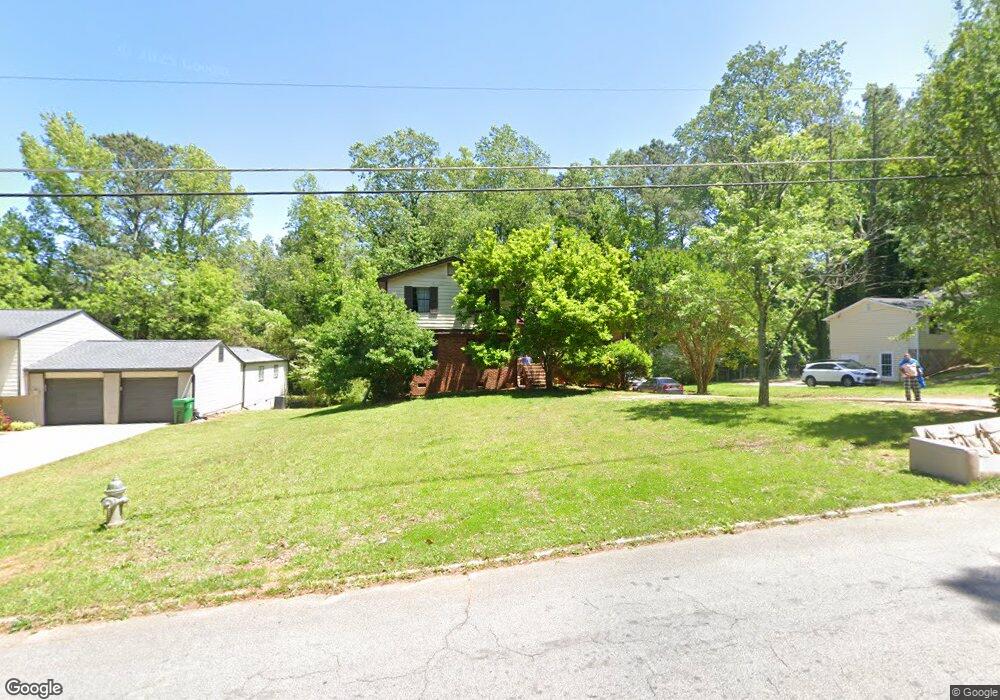
1001 Martin Rd Unit 3 Stone Mountain, GA 30088
Estimated Value: $268,000 - $296,000
4
Beds
3
Baths
2,240
Sq Ft
$125/Sq Ft
Est. Value
About This Home
This home is located at 1001 Martin Rd Unit 3, Stone Mountain, GA 30088 and is currently estimated at $279,541, approximately $124 per square foot. 1001 Martin Rd Unit 3 is a home located in DeKalb County with nearby schools including Eldridge L. Miller Elementary School, Redan Middle School, and Redan High School.
Ownership History
Date
Name
Owned For
Owner Type
Purchase Details
Closed on
Oct 10, 2025
Sold by
Cheung Choy Jamie Kwok
Bought by
Samalex Lp
Current Estimated Value
Purchase Details
Closed on
Dec 6, 2011
Sold by
Belgrave Group Ltd
Bought by
Choy Jamie Kwok Cheung and Cheung Kitson
Purchase Details
Closed on
Nov 22, 2011
Sold by
Deutsche Bank National Tru
Bought by
Belgrave Group Ltd and C/O William Brumby
Purchase Details
Closed on
Sep 6, 2011
Sold by
Mullings Morris
Bought by
Deutsche Bank National Trust C and Indymac Indx Mtg Loan Trust
Purchase Details
Closed on
Apr 28, 2006
Sold by
Mcpherson Myron D and Mcpherson Renae E
Bought by
Mullings Morris
Home Financials for this Owner
Home Financials are based on the most recent Mortgage that was taken out on this home.
Original Mortgage
$115,900
Interest Rate
8%
Mortgage Type
New Conventional
Purchase Details
Closed on
May 1, 1996
Sold by
Velez Carlos R Loida E
Bought by
Mcpherson Renae E
Create a Home Valuation Report for This Property
The Home Valuation Report is an in-depth analysis detailing your home's value as well as a comparison with similar homes in the area
Home Values in the Area
Average Home Value in this Area
Purchase History
| Date | Buyer | Sale Price | Title Company |
|---|---|---|---|
| Samalex Lp | $160,000 | -- | |
| Choy Jamie Kwok Cheung | $68,992 | -- | |
| Belgrave Group Ltd | $36,000 | -- | |
| Deutsche Bank National Trust C | $37,500 | -- | |
| Mullings Morris | $144,900 | -- | |
| Mcpherson Renae E | $100,000 | -- |
Source: Public Records
Mortgage History
| Date | Status | Borrower | Loan Amount |
|---|---|---|---|
| Previous Owner | Mullings Morris | $115,900 | |
| Closed | Mcpherson Renae E | $0 |
Source: Public Records
Tax History Compared to Growth
Tax History
| Year | Tax Paid | Tax Assessment Tax Assessment Total Assessment is a certain percentage of the fair market value that is determined by local assessors to be the total taxable value of land and additions on the property. | Land | Improvement |
|---|---|---|---|---|
| 2025 | $5,108 | $106,280 | $18,000 | $88,280 |
| 2024 | $5,244 | $109,440 | $18,000 | $91,440 |
| 2023 | $5,244 | $107,200 | $18,000 | $89,200 |
| 2022 | $4,182 | $87,240 | $8,000 | $79,240 |
| 2021 | $3,085 | $62,240 | $8,000 | $54,240 |
| 2020 | $2,676 | $52,920 | $8,000 | $44,920 |
| 2019 | $2,284 | $44,000 | $5,400 | $38,600 |
| 2018 | $2,015 | $47,040 | $5,400 | $41,640 |
| 2017 | $2,307 | $44,320 | $5,400 | $38,920 |
| 2016 | $1,802 | $32,800 | $3,920 | $28,880 |
| 2014 | $1,005 | $14,400 | $3,880 | $10,520 |
Source: Public Records
Map
Nearby Homes
- 960 Redan Trail
- 5183 McCarter Ct
- 5233 McCarter Station
- 1051 S Millard Way
- 1071 Redan Trail Ct
- 5242 McCarter Station
- 5085 Rock Glen Dr
- 1060 S Millard Way
- 5215 Mainstreet Park Dr
- 971 Willow Run
- 5192 Mainstreet Park Dr
- 5208 Mainstreet Park Dr
- 1055 Chapman Ln Unit 1
- 1063 Chapman Ln
- 5232 Mainstreet Park Dr
- 871 Lost Creek Cir
- 5268 Fox Path
- 870 Chapman Cir
- 2066 Crossing Rd
- 2072 Crossing Rd
- 991 Martin Rd
- 1007 Martin Rd
- 974 Redan Trail
- 983 Martin Rd Unit 3
- 1015 Martin Rd
- 968 Redan Trail
- 992 Martin Rd
- 5183 McCarter Station
- 1008 Martin Rd
- 980 Redan Trail
- 5161 McCarter Station
- 1021 Martin Rd Unit 3
- 1018 Martin Rd
- 5176 McCarter Station
- 5156 Martin Hills Ct
- 5161 Martin Hills Ct Unit 3
- 5184 McCarter Station
- 5155 McCarter Station
- 950 Rampart Place Unit 2
- 975 Martin Rd