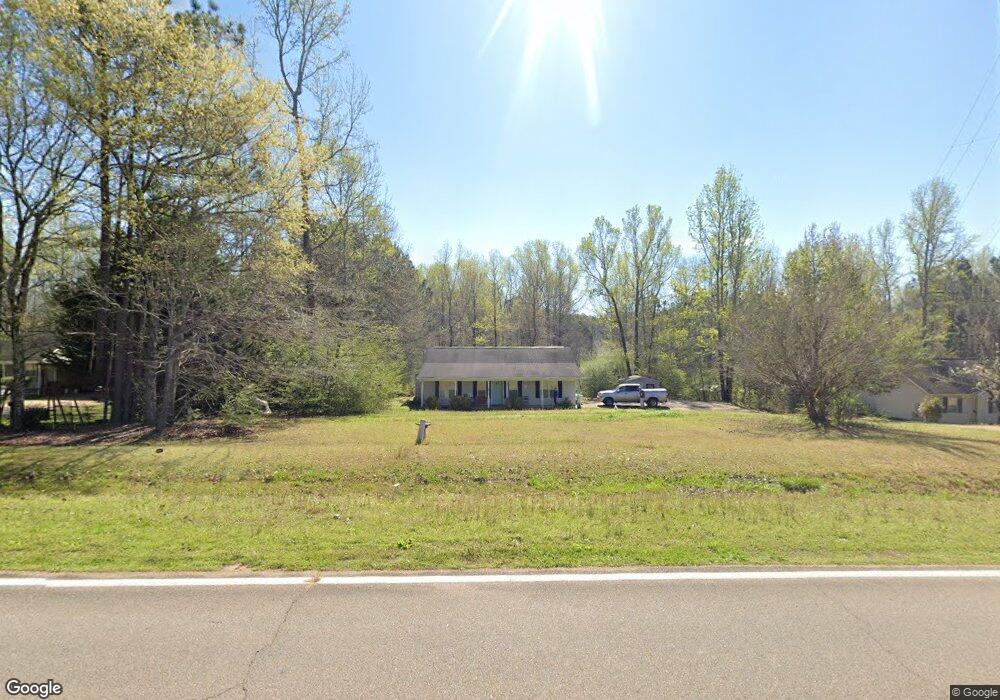
1001 Old West Point Rd Lagrange, GA 30240
Estimated Value: $183,306 - $201,000
3
Beds
2
Baths
1,308
Sq Ft
$147/Sq Ft
Est. Value
About This Home
This home is located at 1001 Old West Point Rd, Lagrange, GA 30240 and is currently estimated at $192,327, approximately $147 per square foot. 1001 Old West Point Rd is a home located in Troup County with nearby schools including Berta Weathersbee Elementary School, Long Cane Elementary School, and Whitesville Road Elementary School.
Ownership History
Date
Name
Owned For
Owner Type
Purchase Details
Closed on
Jun 11, 2007
Sold by
Jp Morgan Chase Bank
Bought by
Cindrick Tiffany
Current Estimated Value
Home Financials for this Owner
Home Financials are based on the most recent Mortgage that was taken out on this home.
Original Mortgage
$94,516
Outstanding Balance
$56,707
Interest Rate
6.1%
Mortgage Type
New Conventional
Estimated Equity
$135,621
Purchase Details
Closed on
Apr 21, 2004
Sold by
Taylor Scott Powell
Bought by
Robert Johnstone
Purchase Details
Closed on
Oct 29, 2002
Sold by
Mitchell Randall Scott
Bought by
Taylor Scott Powell
Purchase Details
Closed on
Nov 3, 1999
Sold by
Barry James
Bought by
Mitchell Randall Scott
Purchase Details
Closed on
Jun 1, 1999
Sold by
Jared Jones and John Dudley
Bought by
Barry James
Purchase Details
Closed on
Dec 22, 1998
Bought by
Jared Jones and John Dudley
Create a Home Valuation Report for This Property
The Home Valuation Report is an in-depth analysis detailing your home's value as well as a comparison with similar homes in the area
Purchase History
| Date | Buyer | Sale Price | Title Company |
|---|---|---|---|
| Cindrick Tiffany | $96,000 | -- | |
| Robert Johnstone | $94,000 | -- | |
| Taylor Scott Powell | -- | -- | |
| Mitchell Randall Scott | $73,800 | -- | |
| Barry James | $10,000 | -- | |
| Jared Jones | -- | -- |
Source: Public Records
Mortgage History
| Date | Status | Borrower | Loan Amount |
|---|---|---|---|
| Open | Cindrick Tiffany | $94,516 |
Source: Public Records
Tax History
| Year | Tax Paid | Tax Assessment Tax Assessment Total Assessment is a certain percentage of the fair market value that is determined by local assessors to be the total taxable value of land and additions on the property. | Land | Improvement |
|---|---|---|---|---|
| 2025 | $1,690 | $67,380 | $10,000 | $57,380 |
| 2024 | $1,520 | $57,740 | $10,000 | $47,740 |
| 2023 | $1,514 | $57,500 | $10,000 | $47,500 |
| 2022 | $1,429 | $53,180 | $10,000 | $43,180 |
| 2021 | $1,177 | $41,008 | $8,000 | $33,008 |
| 2020 | $1,139 | $39,740 | $8,000 | $31,740 |
| 2019 | $1,084 | $37,932 | $6,000 | $31,932 |
| 2018 | $846 | $30,052 | $4,000 | $26,052 |
| 2017 | $846 | $30,052 | $4,000 | $26,052 |
| 2016 | $835 | $29,674 | $4,000 | $25,674 |
| 2015 | $837 | $29,674 | $4,000 | $25,674 |
| 2014 | $797 | $28,305 | $4,000 | $24,305 |
| 2013 | -- | $30,018 | $4,000 | $26,018 |
Source: Public Records
Map
Nearby Homes
- 22 Freeman Rd
- 3009 Old West Point Rd
- 288 Bradfield Dr
- 2239 Pegasus Pkwy
- 105 Redwood Dr
- 808 S Fling Rd
- 0 Bradfield Dr Unit 10568803
- 53 Horace Carter Rd
- 0 Glass Bridge Rd Unit 10679358
- 8 Horace Carter Rd
- 427 Fling Rd
- 509 Connie Dr
- 402 Ginger Cir
- 640 Hudson Rd
- 112 Foxdale Dr
- 3 Reed Dr
- 205 Grady St
- 117 Jones St
- 115 Jones St
- 0 Unit 10514554
- 987 Old West Point Rd
- 1013 Old West Point Rd
- 975 Old West Point Rd
- 1000 Old West Point Rd
- 993 Old West Point Rd
- 963 Old West Point Rd
- 73 Freeman Rd
- 87 Freeman Rd
- 949 Old West Point Rd
- 99 Freeman Rd
- 935 Old West Point Rd
- 78 Freeman Rd
- 2940 Old West Point Rd
- 111 Freeman Rd
- 123 Freeman Rd
- 135 Freeman Rd
- 903 Old West Point Rd
- 2990 Old West Point Rd
- 2960 Old West Point Rd
- 0 Old West Point Rd & Pegasus Pkwy Unit 20147710
Your Personal Tour Guide
Ask me questions while you tour the home.