Estimated Value: $226,608 - $418,000
3
Beds
1
Bath
1,320
Sq Ft
$216/Sq Ft
Est. Value
About This Home
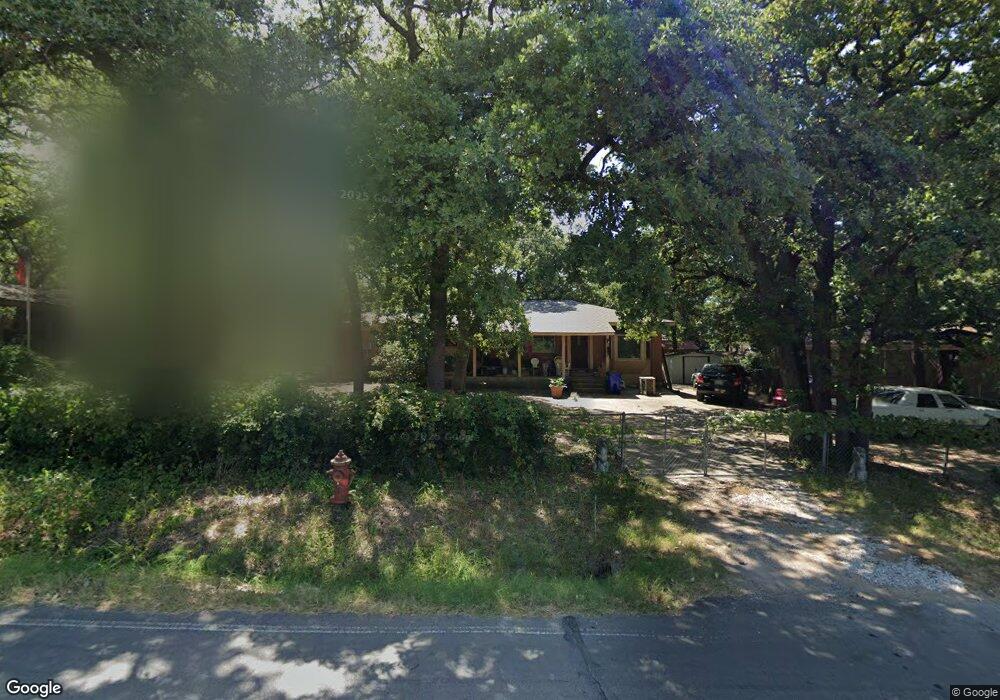
This home is located at 1001 Red Bud Dr, Azle, TX 76020 and is currently estimated at $284,902, approximately $215 per square foot. 1001 Red Bud Dr is a home located in Parker County with nearby schools including Cross Timbers Elementary School, W E Hoover Elementary School, and Santo Forte Junior High School.
Ownership History
Date
Name
Owned For
Owner Type
Purchase Details
Closed on
Dec 10, 2015
Sold by
Stone Russell
Bought by
Ellis Charmaine
Current Estimated Value
Purchase Details
Closed on
Nov 8, 2011
Sold by
Federal National Mortgage Association
Bought by
Ellis Charmaine
Purchase Details
Closed on
Sep 6, 2011
Sold by
Casteel Troy and Casteel Theresa
Bought by
Ellis Charmaine
Purchase Details
Closed on
Apr 6, 2006
Sold by
Bank One National Association As Trustee
Bought by
Ellis Charmaine
Home Financials for this Owner
Home Financials are based on the most recent Mortgage that was taken out on this home.
Original Mortgage
$44,910
Interest Rate
10.9%
Mortgage Type
New Conventional
Purchase Details
Closed on
Dec 6, 2005
Sold by
Luster Diane Mcfarlin
Bought by
Ellis Charmaine
Create a Home Valuation Report for This Property
The Home Valuation Report is an in-depth analysis detailing your home's value as well as a comparison with similar homes in the area
Home Values in the Area
Average Home Value in this Area
Purchase History
| Date | Buyer | Sale Price | Title Company |
|---|---|---|---|
| Ellis Charmaine | -- | Fatco | |
| Ellis Charmaine | -- | -- | |
| Stone Russell | -- | Ctc | |
| Ellis Charmaine | -- | -- | |
| Federal National Mortgage Association | $71,661 | None Available | |
| Ellis Charmaine | -- | -- | |
| Casteel Troy | -- | Allegiance Title Company | |
| Ellis Charmaine | -- | -- |
Source: Public Records
Mortgage History
| Date | Status | Borrower | Loan Amount |
|---|---|---|---|
| Previous Owner | Casteel Troy | $44,910 |
Source: Public Records
Tax History Compared to Growth
Tax History
| Year | Tax Paid | Tax Assessment Tax Assessment Total Assessment is a certain percentage of the fair market value that is determined by local assessors to be the total taxable value of land and additions on the property. | Land | Improvement |
|---|---|---|---|---|
| 2025 | $1,251 | $226,562 | $65,000 | $161,562 |
| 2024 | $1,251 | $252,840 | $65,000 | $187,840 |
| 2023 | $1,251 | $252,840 | $65,000 | $187,840 |
| 2022 | $3,982 | $167,760 | $36,000 | $131,760 |
| 2021 | $4,187 | $167,760 | $36,000 | $131,760 |
| 2020 | $2,598 | $104,540 | $14,620 | $89,920 |
| 2019 | $2,730 | $104,540 | $14,620 | $89,920 |
| 2018 | $2,159 | $82,350 | $15,000 | $67,350 |
| 2017 | $2,086 | $82,350 | $15,000 | $67,350 |
| 2016 | $1,503 | $59,330 | $10,000 | $49,330 |
| 2015 | $369 | $59,330 | $10,000 | $49,330 |
| 2014 | $1,484 | $58,980 | $10,000 | $48,980 |
Source: Public Records
Map
Nearby Homes
- 1008 Rosebud Dr
- TBD Ethridge Dr
- 840 Red Oak Ct
- 1024 Red Oak St
- 833 Boyd Rd
- 501 Red Bud Dr
- 849 Jackson Trail
- 829 Lake Crest Pkwy
- 2001 Forest Bridge Dr
- 416 Misty Oaks St
- 420 Meadowcrest Dr
- 749 Oak Park Dr
- 13449 S Fm 730
- 629 Tracy Dr
- 525 Inwood Rd
- 513 Cottage Ct
- 508 Woodland Dr
- 561 Ascot Way
- 6697 Farm To Market Road 730 N
- 3.760 acres Boyd Rd