Estimated Value: $179,000 - $213,000
3
Beds
2
Baths
1,446
Sq Ft
$135/Sq Ft
Est. Value
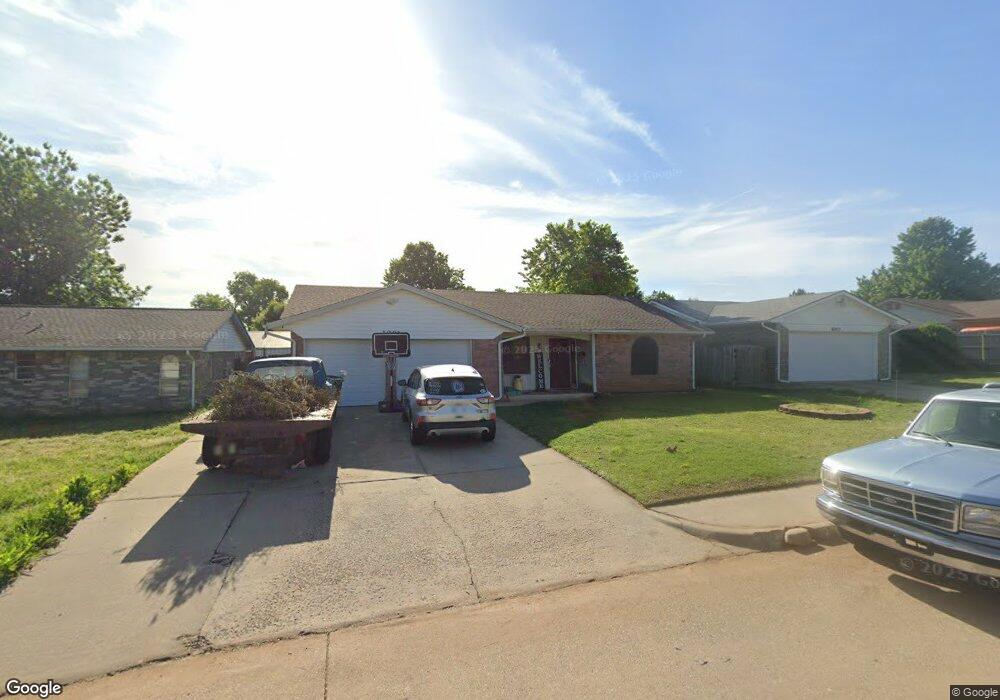
About This Home
This home is located at 1001 Ridgeway Dr, Yukon, OK 73099 and is currently estimated at $194,968, approximately $134 per square foot. 1001 Ridgeway Dr is a home located in Canadian County with nearby schools including Myers Elementary School, Independence Elementary School, and Yukon Middle School.
Ownership History
Date
Name
Owned For
Owner Type
Purchase Details
Closed on
Apr 4, 2007
Sold by
Maar Robert and Maar Gabriela
Bought by
Maar Robert and Maar Gabriela
Current Estimated Value
Home Financials for this Owner
Home Financials are based on the most recent Mortgage that was taken out on this home.
Original Mortgage
$44,152
Outstanding Balance
$26,812
Interest Rate
6.32%
Mortgage Type
FHA
Estimated Equity
$168,156
Purchase Details
Closed on
Mar 19, 2007
Sold by
Long Deanna L and Long William C
Bought by
Maar Robert
Home Financials for this Owner
Home Financials are based on the most recent Mortgage that was taken out on this home.
Original Mortgage
$44,152
Outstanding Balance
$26,812
Interest Rate
6.32%
Mortgage Type
FHA
Estimated Equity
$168,156
Purchase Details
Closed on
Mar 29, 2001
Sold by
Eberlein Edwin E
Purchase Details
Closed on
Nov 1, 1999
Sold by
Poage Robert and Poage L
Create a Home Valuation Report for This Property
The Home Valuation Report is an in-depth analysis detailing your home's value as well as a comparison with similar homes in the area
Home Values in the Area
Average Home Value in this Area
Purchase History
| Date | Buyer | Sale Price | Title Company |
|---|---|---|---|
| Maar Robert | -- | None Available | |
| Maar Robert | $85,125 | None Available | |
| -- | $75,000 | -- | |
| -- | $78,500 | -- |
Source: Public Records
Mortgage History
| Date | Status | Borrower | Loan Amount |
|---|---|---|---|
| Open | Maar Robert | $44,152 |
Source: Public Records
Tax History Compared to Growth
Tax History
| Year | Tax Paid | Tax Assessment Tax Assessment Total Assessment is a certain percentage of the fair market value that is determined by local assessors to be the total taxable value of land and additions on the property. | Land | Improvement |
|---|---|---|---|---|
| 2024 | $1,546 | $16,031 | $1,980 | $14,051 |
| 2023 | $1,546 | $15,268 | $1,980 | $13,288 |
| 2022 | $1,504 | $14,823 | $1,980 | $12,843 |
| 2021 | $1,462 | $14,392 | $1,980 | $12,412 |
| 2020 | $1,399 | $13,972 | $1,980 | $11,992 |
| 2019 | $1,359 | $13,566 | $1,980 | $11,586 |
| 2018 | $1,321 | $13,179 | $1,980 | $11,199 |
| 2017 | $1,280 | $12,796 | $1,980 | $10,816 |
| 2016 | $1,257 | $12,933 | $1,980 | $10,953 |
| 2015 | $1,251 | $12,211 | $1,980 | $10,231 |
| 2014 | $1,251 | $12,350 | $1,980 | $10,370 |
Source: Public Records
Map
Nearby Homes
- 904 Glenwood Dr
- 810 Ridgeway Dr
- 301 Fay Ave
- 1004 Ranchoak Ct
- 0 Landon Ln
- 11501 NW 97th St
- 725 Ranchoak Dr
- 3225 Pagoda Pead Dr
- 723 Garden Grove
- 201 Vine St
- 732 Royal Ln
- 804 Royal Ln
- 1300 Katelyn Ct
- 816 Royal Ln
- 736 Mabel C Fry Blvd
- 744 Mabel C Fry Blvd
- 9213 NW 147th Terrace
- 9209 NW 147th Terrace
- 1324 Katelyn Ct
- 1305 Katelyn Ct
- 1003 Ridgeway Dr
- 905 Ridgeway Dr
- 1005 Ridgeway Dr
- 1002 Cherrywood Ln
- 1000 Ridgeway Dr
- 906 Ridgeway Dr
- 1002 Ridgeway Dr
- 904 Cherrywood Ln
- 906 Cherrywood Ln
- 1007 Ridgeway Dr
- 1004 Cherrywood Ln
- 903 Ridgeway Dr
- 1004 Ridgeway Dr
- 904 Ridgeway Dr
- 901 Ridgeway Dr
- 902 Cherrywood Ln
- 902 Ridgeway Dr
- 1101 Ridgeway Dr
- 1100 Cherrywood Ln
- 900 Cherrywood Ln