--
Bed
--
Bath
2,591
Sq Ft
0.49
Acres
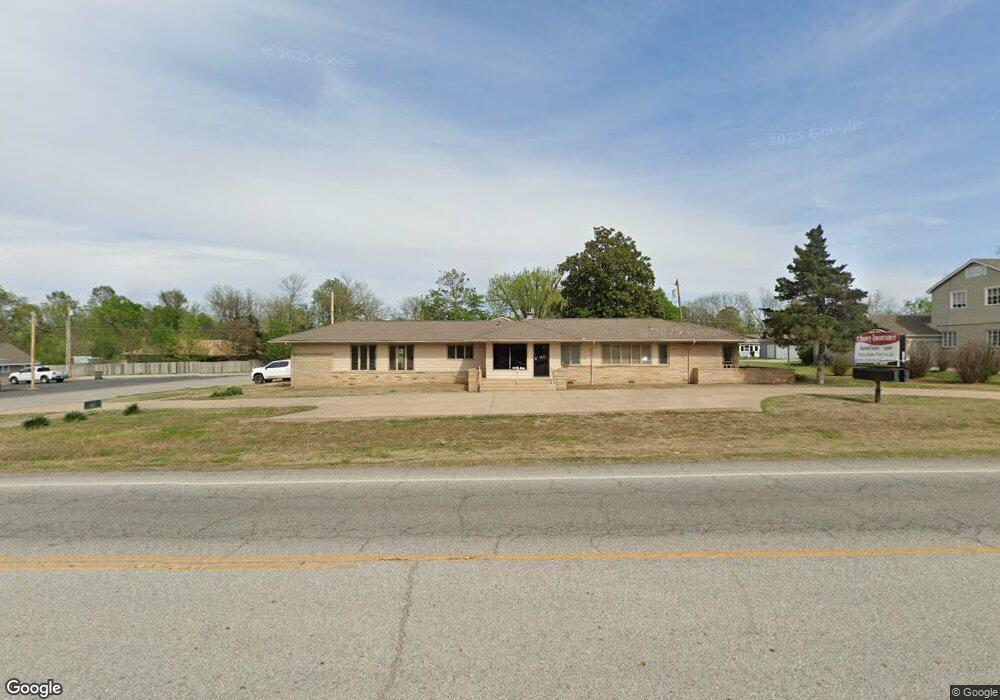
About This Home
This home is located at 1001 S Main St, Grove, OK 74344. 1001 S Main St is a home located in Delaware County with nearby schools including Grove Lower Elementary School, Grove Upper Elementary School, and Grove Middle School.
Ownership History
Date
Name
Owned For
Owner Type
Purchase Details
Closed on
Oct 14, 2024
Sold by
Mat Thompson Trust and Thompson Michael A
Bought by
Chaney Jarrod
Home Financials for this Owner
Home Financials are based on the most recent Mortgage that was taken out on this home.
Original Mortgage
$675,000
Outstanding Balance
$553,125
Interest Rate
5%
Mortgage Type
Seller Take Back
Purchase Details
Closed on
Sep 3, 1997
Sold by
Halterman Norma Jean
Bought by
Thompson Mike and Thompson Ann
Purchase Details
Closed on
Feb 24, 1979
Sold by
Ray Herbert
Create a Home Valuation Report for This Property
The Home Valuation Report is an in-depth analysis detailing your home's value as well as a comparison with similar homes in the area
Home Values in the Area
Average Home Value in this Area
Purchase History
| Date | Buyer | Sale Price | Title Company |
|---|---|---|---|
| Chaney Jarrod | $775,000 | None Listed On Document | |
| Thompson Mike | $200,000 | -- | |
| -- | -- | -- |
Source: Public Records
Mortgage History
| Date | Status | Borrower | Loan Amount |
|---|---|---|---|
| Open | Chaney Jarrod | $675,000 |
Source: Public Records
Tax History Compared to Growth
Tax History
| Year | Tax Paid | Tax Assessment Tax Assessment Total Assessment is a certain percentage of the fair market value that is determined by local assessors to be the total taxable value of land and additions on the property. | Land | Improvement |
|---|---|---|---|---|
| 2025 | $3,519 | $69,115 | $21,706 | $47,409 |
| 2024 | $3,519 | $43,455 | $13,391 | $30,064 |
| 2023 | $3,519 | $41,385 | $13,223 | $28,162 |
| 2022 | $3,291 | $41,385 | $13,223 | $28,162 |
| 2021 | $3,127 | $38,432 | $13,225 | $25,207 |
| 2020 | $3,029 | $37,538 | $13,216 | $24,322 |
| 2019 | $2,895 | $34,048 | $13,180 | $20,868 |
| 2018 | $2,752 | $34,048 | $13,187 | $20,861 |
| 2017 | $2,629 | $32,427 | $13,163 | $19,264 |
| 2016 | $2,503 | $29,412 | $13,110 | $16,302 |
| 2015 | $2,539 | $29,412 | $13,110 | $16,302 |
| 2014 | $2,551 | $29,412 | $13,110 | $16,302 |
Source: Public Records
Map
Nearby Homes