Estimated Value: $512,000 - $595,000
3
Beds
3
Baths
3,278
Sq Ft
$168/Sq Ft
Est. Value
About This Home
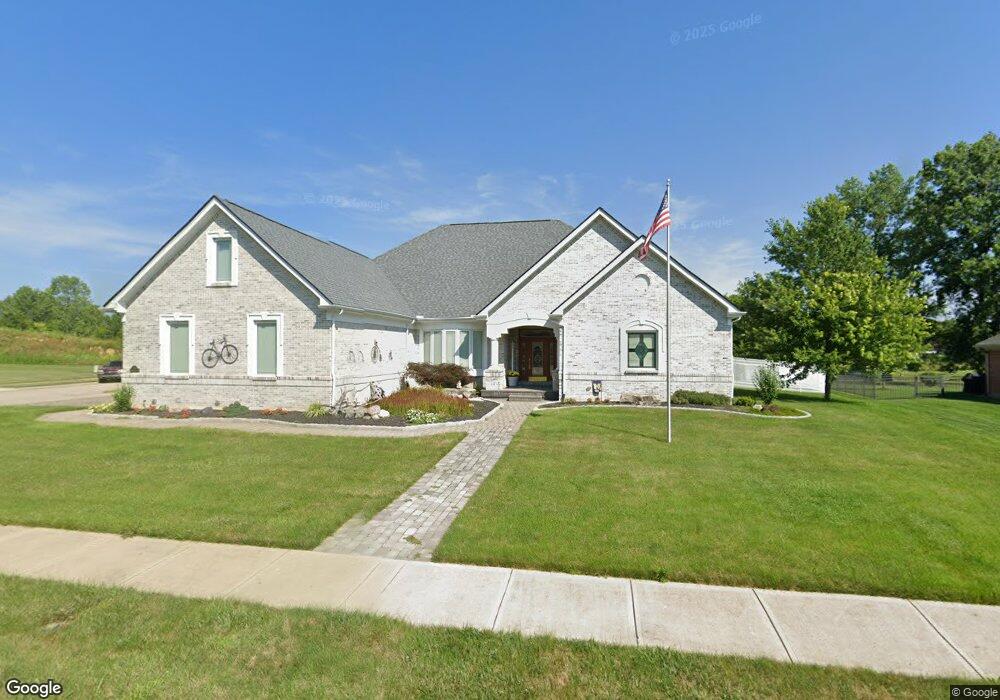
This home is located at 1001 Scenic View Dr, Xenia, OH 45385 and is currently estimated at $549,111, approximately $167 per square foot. 1001 Scenic View Dr is a home located in Greene County with nearby schools including Xenia High School, Summit Academy Community School for Alternative Learners - Xenia, and Legacy Christian Academy.
Ownership History
Date
Name
Owned For
Owner Type
Purchase Details
Closed on
Apr 2, 2015
Sold by
Galbraith Kent R and Galbraith Pamela R
Bought by
The Galbraith Family Trust
Current Estimated Value
Home Financials for this Owner
Home Financials are based on the most recent Mortgage that was taken out on this home.
Original Mortgage
$130,000
Outstanding Balance
$47,749
Interest Rate
3.77%
Mortgage Type
New Conventional
Estimated Equity
$501,362
Purchase Details
Closed on
Jul 12, 2010
Sold by
Hiney Todd J
Bought by
Hiney Todd J
Purchase Details
Closed on
Aug 20, 2007
Sold by
Hiney Louise C
Bought by
Hiney Louise C and Louise C Hiney Revocable Trust
Purchase Details
Closed on
Jul 21, 2005
Sold by
P F D Development Pll
Bought by
Hiney Louise C
Create a Home Valuation Report for This Property
The Home Valuation Report is an in-depth analysis detailing your home's value as well as a comparison with similar homes in the area
Home Values in the Area
Average Home Value in this Area
Purchase History
| Date | Buyer | Sale Price | Title Company |
|---|---|---|---|
| The Galbraith Family Trust | -- | Attorney | |
| Galbraith Kent R | $342,000 | Attorney | |
| Hiney Todd J | $305,000 | Attorney | |
| Hiney Louise C | -- | Attorney | |
| Hiney Louise C | $65,000 | -- |
Source: Public Records
Mortgage History
| Date | Status | Borrower | Loan Amount |
|---|---|---|---|
| Open | Galbraith Kent R | $130,000 |
Source: Public Records
Tax History Compared to Growth
Tax History
| Year | Tax Paid | Tax Assessment Tax Assessment Total Assessment is a certain percentage of the fair market value that is determined by local assessors to be the total taxable value of land and additions on the property. | Land | Improvement |
|---|---|---|---|---|
| 2024 | $6,434 | $164,070 | $23,350 | $140,720 |
| 2023 | $6,434 | $164,070 | $23,350 | $140,720 |
| 2022 | $5,695 | $125,150 | $15,560 | $109,590 |
| 2021 | $5,772 | $125,150 | $15,560 | $109,590 |
| 2020 | $5,400 | $125,150 | $15,560 | $109,590 |
| 2019 | $5,400 | $115,860 | $20,100 | $95,760 |
| 2018 | $5,419 | $115,860 | $20,100 | $95,760 |
| 2017 | $5,260 | $115,860 | $20,100 | $95,760 |
| 2016 | $5,122 | $108,080 | $20,100 | $87,980 |
| 2015 | $2,869 | $108,080 | $20,100 | $87,980 |
| 2014 | $2,747 | $108,080 | $20,100 | $87,980 |
Source: Public Records
Map
Nearby Homes
- 2144 Tandem Dr
- 2223 Tandem Dr
- 2096 High Wheel Dr
- 2540 Cornwall Dr
- 0 Berkshire Dr Unit 942854
- 2540 Jenny Marie Dr
- 2421 Louisiana Dr
- 2499 Jenny Marie Dr
- 2821 Raxit Ct
- 2852 Raxit Ct
- 1068 Hedges Rd
- 2187 Minnesota Dr
- 2265 Minnesota Dr
- 1255 Colorado Dr
- 1881 Commonwealth Dr
- 2685 Childers Dr
- 1908 Whitt St
- 2189 Mississippi Dr
- 2705 Tennessee Dr
- Henley Plan at Edenbridge
- lot # 199 Scenic View Dr
- 2100 Lakeview Dr
- 1000 Scenic View Dr
- 2090 Lakeview Dr
- 2115 Lakeview Dr
- 2107 Lakeview Dr
- 2099 Lakeview Dr
- 2123 Lakeview Dr
- 2091 Lakeview Dr
- 2083 Lakeview Dr
- 2075 Lakeview Dr
- 2067 Lakeview Dr
- 2057 Lakeview Dr
- 2030 Lakeview Dr
- 2047 Lakeview Dr
- 2047 Lakeview Dr Unit Lot 189 SEC 11
- 2020 Lakeview Dr
- 2010 Lakeview Dr
- 2039 Lakeview Dr
- 2031 Lakeview Dr