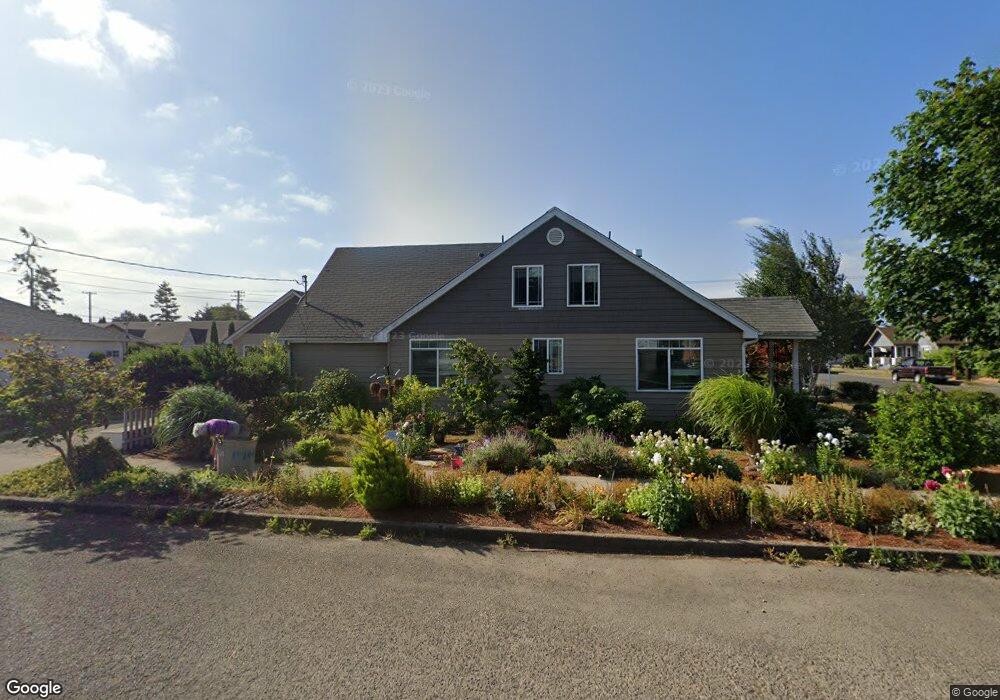
1001 Stillwell Ave Tillamook, OR 97141
Estimated Value: $412,000 - $438,063
4
Beds
2
Baths
2,076
Sq Ft
$205/Sq Ft
Est. Value
About This Home
This home is located at 1001 Stillwell Ave, Tillamook, OR 97141 and is currently estimated at $425,766, approximately $205 per square foot. 1001 Stillwell Ave is a home located in Tillamook County with nearby schools including Tillamook High School, Little Clipper Preschool, and Tillamook Adventist School.
Ownership History
Date
Name
Owned For
Owner Type
Purchase Details
Closed on
Jul 22, 2008
Sold by
National Residential Nominee Svcs Inc
Bought by
Rouse Shannon L
Current Estimated Value
Purchase Details
Closed on
Mar 19, 2008
Sold by
Cherefko Chad L
Bought by
National Residential Nominee Svcs Inc
Purchase Details
Closed on
Aug 1, 2005
Sold by
Conover Larry Dean
Bought by
Cherefko Chad L
Home Financials for this Owner
Home Financials are based on the most recent Mortgage that was taken out on this home.
Original Mortgage
$101,600
Interest Rate
5.56%
Mortgage Type
Fannie Mae Freddie Mac
Purchase Details
Closed on
Jun 7, 2004
Sold by
Conover Colleen Virginia
Bought by
Conover Larry Dean
Create a Home Valuation Report for This Property
The Home Valuation Report is an in-depth analysis detailing your home's value as well as a comparison with similar homes in the area
Home Values in the Area
Average Home Value in this Area
Purchase History
| Date | Buyer | Sale Price | Title Company |
|---|---|---|---|
| Rouse Shannon L | $244,000 | Ticor Title Insurance | |
| National Residential Nominee Svcs Inc | $242,750 | Ticor Title Insurance | |
| Cherefko Chad L | $128,000 | Ticor Title Ins Co | |
| Conover Larry Dean | $60,000 | -- |
Source: Public Records
Mortgage History
| Date | Status | Borrower | Loan Amount |
|---|---|---|---|
| Previous Owner | Cherefko Chad L | $101,600 |
Source: Public Records
Tax History Compared to Growth
Tax History
| Year | Tax Paid | Tax Assessment Tax Assessment Total Assessment is a certain percentage of the fair market value that is determined by local assessors to be the total taxable value of land and additions on the property. | Land | Improvement |
|---|---|---|---|---|
| 2024 | $2,081 | $176,590 | $53,330 | $123,260 |
| 2023 | $2,061 | $171,450 | $51,780 | $119,670 |
| 2022 | $1,991 | $166,460 | $50,270 | $116,190 |
| 2021 | $1,932 | $161,620 | $48,810 | $112,810 |
| 2020 | $1,879 | $156,920 | $47,390 | $109,530 |
| 2019 | $1,831 | $152,350 | $46,010 | $106,340 |
| 2018 | $1,784 | $147,920 | $44,670 | $103,250 |
| 2017 | $1,739 | $143,620 | $43,370 | $100,250 |
| 2016 | $1,674 | $139,440 | $42,110 | $97,330 |
| 2015 | $1,640 | $135,380 | $40,880 | $94,500 |
| 2014 | $1,612 | $131,440 | $39,690 | $91,750 |
| 2013 | -- | $127,620 | $38,530 | $89,090 |
Source: Public Records
Map
Nearby Homes
- 1007 Stillwell Ave
- 1807 10th St
- 1009 Stillwell Ave
- 1811 10th St
- 915 Stillwell Ave
- 1806 10th St
- 1015 Stillwell Ave
- 1002 Stillwell Ave
- 1004 Stillwell Ave
- 1812 10th St
- 913 Stillwell Ave
- 1816 10th St
- 1014 Stillwell Ave
- 916 Stillwell Ave
- 1903 10th St
- 1707 10th St
- 1007 Ivy Ave
- 901 Stillwell Ave
- 1801 11th St
- 1811 9th St