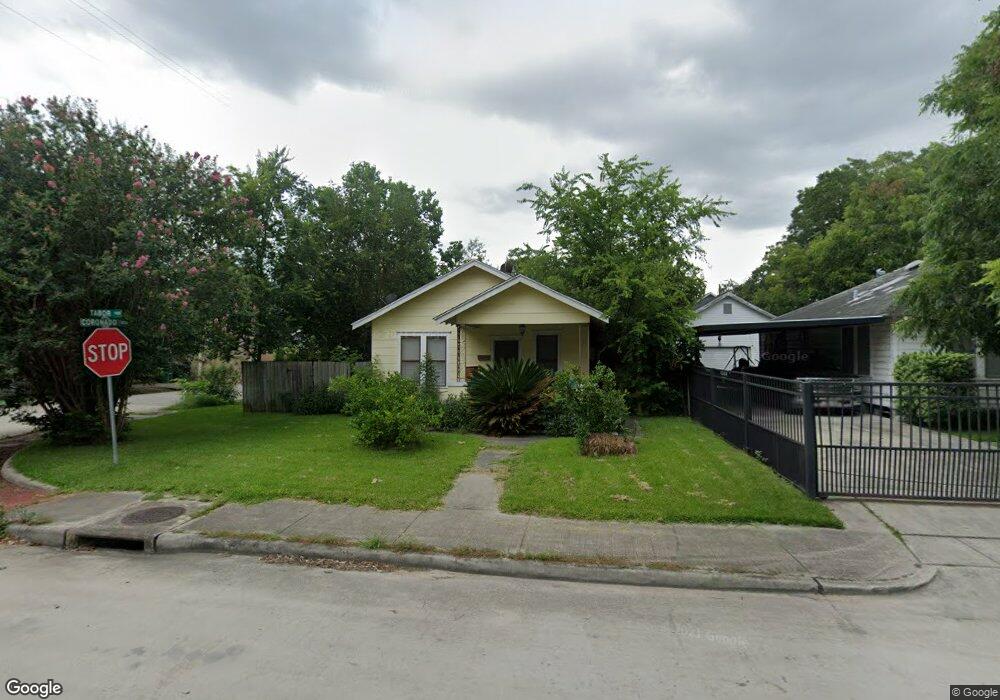
1001 Tabor St Houston, TX 77009
Greater Heights NeighborhoodEstimated Value: $365,000 - $452,000
2
Beds
1
Bath
960
Sq Ft
$407/Sq Ft
Est. Value
About This Home
This home is located at 1001 Tabor St, Houston, TX 77009 and is currently estimated at $390,560, approximately $406 per square foot. 1001 Tabor St is a home located in Harris County with nearby schools including Browning Elementary School, Hogg Middle, and Heights High School.
Ownership History
Date
Name
Owned For
Owner Type
Purchase Details
Closed on
Sep 10, 2014
Sold by
Duplantis Joan Stout
Bought by
Reed Nicholas D
Current Estimated Value
Purchase Details
Closed on
Jan 26, 1999
Sold by
Lennar Homes Of Texas Land & Const Ltd
Bought by
Emmott Kenneth K and Emmott Roxanne
Home Financials for this Owner
Home Financials are based on the most recent Mortgage that was taken out on this home.
Original Mortgage
$191,100
Interest Rate
6.79%
Purchase Details
Closed on
Dec 22, 1998
Sold by
Wang Yucheng Michael
Bought by
Duong Phuoc and Duong Quan
Home Financials for this Owner
Home Financials are based on the most recent Mortgage that was taken out on this home.
Original Mortgage
$191,100
Interest Rate
6.79%
Purchase Details
Closed on
Dec 4, 1997
Sold by
Schneider Carran
Bought by
Fuplante Joan S
Home Financials for this Owner
Home Financials are based on the most recent Mortgage that was taken out on this home.
Original Mortgage
$36,000
Interest Rate
7.2%
Create a Home Valuation Report for This Property
The Home Valuation Report is an in-depth analysis detailing your home's value as well as a comparison with similar homes in the area
Home Values in the Area
Average Home Value in this Area
Purchase History
| Date | Buyer | Sale Price | Title Company |
|---|---|---|---|
| Reed Nicholas D | -- | None Available | |
| Emmott Kenneth K | -- | Regency Title | |
| Duong Phuoc | -- | Texas American Title Company | |
| Fuplante Joan S | -- | -- |
Source: Public Records
Mortgage History
| Date | Status | Borrower | Loan Amount |
|---|---|---|---|
| Previous Owner | Emmott Kenneth K | $191,100 | |
| Previous Owner | Duong Phuoc | $69,350 | |
| Previous Owner | Fuplante Joan S | $36,000 |
Source: Public Records
Tax History Compared to Growth
Tax History
| Year | Tax Paid | Tax Assessment Tax Assessment Total Assessment is a certain percentage of the fair market value that is determined by local assessors to be the total taxable value of land and additions on the property. | Land | Improvement |
|---|---|---|---|---|
| 2025 | $4,436 | $336,083 | $300,000 | $36,083 |
| 2024 | $4,436 | $333,403 | $300,000 | $33,403 |
| 2023 | $4,436 | $287,608 | $250,000 | $37,608 |
| 2022 | $6,139 | $278,804 | $250,000 | $28,804 |
| 2021 | $6,434 | $276,050 | $250,000 | $26,050 |
| 2020 | $6,259 | $258,449 | $235,000 | $23,449 |
| 2019 | $6,557 | $259,119 | $235,000 | $24,119 |
| 2018 | $4,771 | $249,368 | $225,000 | $24,368 |
| 2017 | $6,164 | $249,368 | $225,000 | $24,368 |
| 2016 | $5,604 | $226,469 | $200,000 | $26,469 |
| 2015 | $3,576 | $201,469 | $175,000 | $26,469 |
| 2014 | $3,576 | $149,126 | $125,000 | $24,126 |
Source: Public Records
Map
Nearby Homes
- 910 Coronado St
- 903 Tabor St
- 1101 Tabor St
- 808 Coronado St
- 1006 Enid St Unit B
- 805 Walton St
- 1202 Walton St
- 804 Enid St Unit A
- 802 Enid St
- Cordell Street Plan at Cordell Estates
- 1209 Tabor St
- 1213 Northwood St
- 1006 Archer St
- 1718 Redwing Ridge Dr
- 1723 Redwing Ridge Dr
- 1108 Archer St
- 612 Pittman St
- 611 Mathis St
- 1207 Archer St
- 809 Vincent St
- 1003 Tabor St
- 1005 Tabor St
- 911 Tabor St
- 1002 Northwood St
- 1004 Northwood St
- 1002 Tabor St
- 909 Tabor St
- 912 Northwood St
- 1007 Tabor St
- 1007 Tabor St Unit A
- 1007 Tabor St Unit B
- 1006 Northwood St
- 1004 Tabor St
- 912 Tabor St
- 1006 Tabor St
- 910 Northwood St
- 1008 Northwood St
- 907 Tabor St
- 910 Tabor St
- 1008 Tabor St