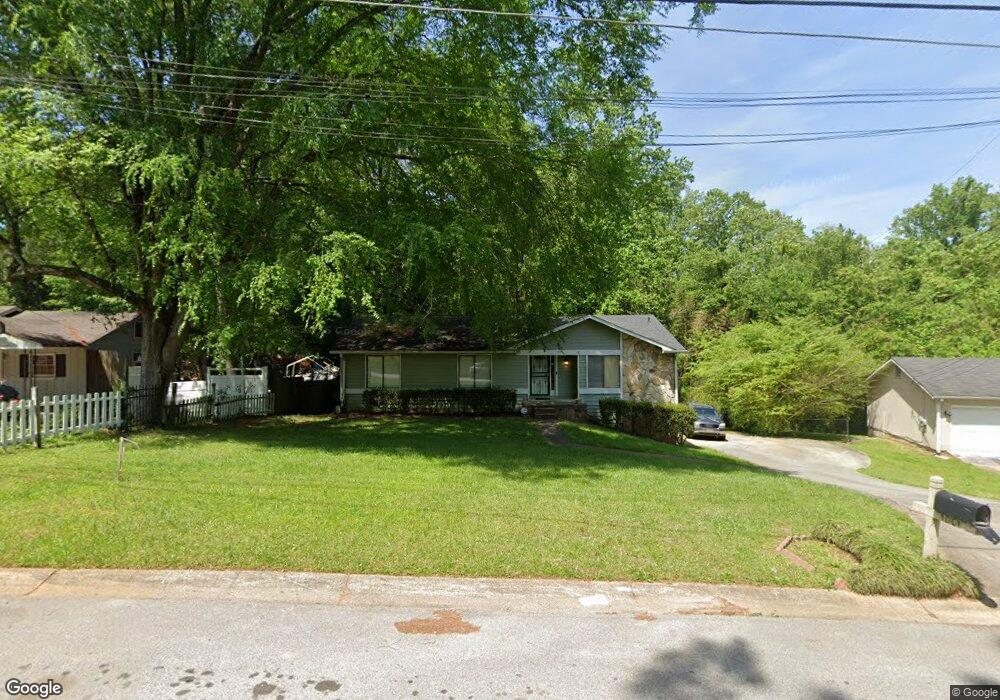
1001 Timberclair Way Lithonia, GA 30058
Estimated Value: $227,000 - $240,000
3
Beds
3
Baths
1,279
Sq Ft
$182/Sq Ft
Est. Value
About This Home
This home is located at 1001 Timberclair Way, Lithonia, GA 30058 and is currently estimated at $232,142, approximately $181 per square foot. 1001 Timberclair Way is a home located in DeKalb County with nearby schools including Princeton Elementary School, Stephenson Middle School, and Stephenson High School.
Ownership History
Date
Name
Owned For
Owner Type
Purchase Details
Closed on
Aug 7, 2017
Sold by
Genesis Prop Investment Llc
Bought by
Williamson Christopher J
Current Estimated Value
Home Financials for this Owner
Home Financials are based on the most recent Mortgage that was taken out on this home.
Original Mortgage
$118,808
Outstanding Balance
$100,062
Interest Rate
4.4%
Mortgage Type
FHA
Estimated Equity
$132,080
Purchase Details
Closed on
Jul 30, 2010
Sold by
Clark Demetri
Bought by
Genesis Property Invs Llc
Purchase Details
Closed on
Jun 5, 2007
Sold by
Washington Tangela
Bought by
Carrington Mtg Ln Trust 2006-N
Purchase Details
Closed on
Oct 1, 1999
Sold by
Frazier Alphonso
Bought by
Washington Tangela
Home Financials for this Owner
Home Financials are based on the most recent Mortgage that was taken out on this home.
Original Mortgage
$104,141
Interest Rate
7.91%
Mortgage Type
FHA
Purchase Details
Closed on
Apr 25, 1995
Sold by
Smith Milton S Belinda
Bought by
Frazier Alphonso Carla
Create a Home Valuation Report for This Property
The Home Valuation Report is an in-depth analysis detailing your home's value as well as a comparison with similar homes in the area
Home Values in the Area
Average Home Value in this Area
Purchase History
| Date | Buyer | Sale Price | Title Company |
|---|---|---|---|
| Williamson Christopher J | $121,000 | -- | |
| Genesis Property Invs Llc | -- | -- | |
| Clark Demetri | $18,000 | -- | |
| Carrington Mtg Ln Trust 2006-N | $93,000 | -- | |
| Washington Tangela | $105,000 | -- | |
| Frazier Alphonso Carla | $73,900 | -- |
Source: Public Records
Mortgage History
| Date | Status | Borrower | Loan Amount |
|---|---|---|---|
| Open | Williamson Christopher J | $118,808 | |
| Previous Owner | Washington Tangela | $104,141 | |
| Closed | Frazier Alphonso Carla | $0 |
Source: Public Records
Tax History
| Year | Tax Paid | Tax Assessment Tax Assessment Total Assessment is a certain percentage of the fair market value that is determined by local assessors to be the total taxable value of land and additions on the property. | Land | Improvement |
|---|---|---|---|---|
| 2025 | $2,873 | $103,200 | $16,000 | $87,200 |
| 2024 | $2,986 | $105,560 | $16,000 | $89,560 |
| 2023 | $2,986 | $107,280 | $16,000 | $91,280 |
Source: Public Records
Map
Nearby Homes
- 6973 Kimberland Gardens Ln
- 6743 Timbers Dr E
- 1086 Deshon Trail
- 1773 Stephenson Rd
- 1039 Glade Run
- 7074 Brecken Place
- 886 Deshon Creek Dr
- 1168 Stephenson Rd
- 6852 Yorkdale Ct
- 6820 Yorkdale Ct
- 1291 S Deshon Rd
- 7094 Deshon Bend Cir
- 7071 Deshon Hills Ln
- 7129 Timberland Trail
- 6675 Princeton Park Ct
- 1095 Kingsley Way
- 1082 Kingsley Way Unit LOT 27
- 1082 Kingsley Way - Lot 27
- 6701 Wehunt Way
- 1070 Kingsley Way Unit LOT 29
- 993 Timberclair Way
- 993 Timberclair Way
- 6876 Timbers Dr E
- 1009 Timberclair Way
- 6876 Timbers East Dr
- 6868 Timbers East Dr Unit 1
- 6900 Timbers East Dr
- 6900 Timbers Dr E
- 990 Timberclair Way
- 6860 Timbers East Dr Unit 1
- 6887 Timbers East Dr
- 6887 Timbers Dr E
- 6875 Timbers East Dr Unit 1
- 6875 Timbers Dr E
- 6875 E Timbers East Dr E
- 6910 Timbers East Dr Unit 1
- 6875 E Timbers East Drive E 0
- 6899 Timbers East Dr
- 6899 Timbers Dr E
- 979 Timberclair Way
Your Personal Tour Guide
Ask me questions while you tour the home.