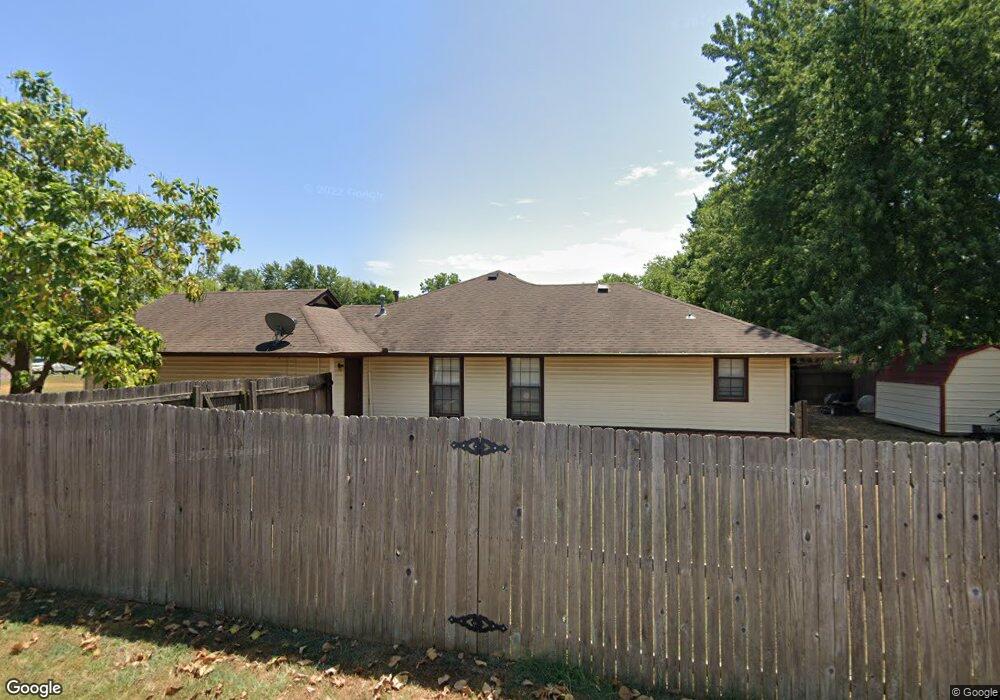
1001 W 23rd St N Claremore, OK 74017
Estimated Value: $211,000 - $221,695
3
Beds
2
Baths
1,423
Sq Ft
$153/Sq Ft
Est. Value
About This Home
This home is located at 1001 W 23rd St N, Claremore, OK 74017 and is currently estimated at $217,924, approximately $153 per square foot. 1001 W 23rd St N is a home located in Rogers County with nearby schools including Roosa Elementary School, Will Rogers Junior High School, and Claremore High School.
Ownership History
Date
Name
Owned For
Owner Type
Purchase Details
Closed on
Sep 25, 2020
Sold by
Taylor Mallory E
Bought by
Taylor Robert and Leggett Susan
Current Estimated Value
Home Financials for this Owner
Home Financials are based on the most recent Mortgage that was taken out on this home.
Original Mortgage
$136,482
Outstanding Balance
$120,843
Interest Rate
2.9%
Mortgage Type
FHA
Estimated Equity
$97,081
Purchase Details
Closed on
Apr 8, 2016
Sold by
Brown Christopher K and Brown Emily E
Bought by
Taylor Mallory E
Home Financials for this Owner
Home Financials are based on the most recent Mortgage that was taken out on this home.
Original Mortgage
$116,885
Interest Rate
3.62%
Mortgage Type
New Conventional
Purchase Details
Closed on
May 20, 2011
Sold by
Moss Linda L
Bought by
Brown Christopher K and Brown Emily E
Purchase Details
Closed on
Feb 11, 2004
Sold by
Chumley & Associates Inc
Purchase Details
Closed on
Oct 28, 2003
Sold by
Greco Properties Inc
Create a Home Valuation Report for This Property
The Home Valuation Report is an in-depth analysis detailing your home's value as well as a comparison with similar homes in the area
Home Values in the Area
Average Home Value in this Area
Purchase History
| Date | Buyer | Sale Price | Title Company |
|---|---|---|---|
| Taylor Robert | $139,000 | Apex Ttl & Closing Svcs Llc | |
| Taylor Mallory E | $120,500 | Apex Title & Closing Service | |
| Brown Christopher K | $113,500 | Rogers C Abstract Escrow | |
| -- | $111,000 | -- | |
| -- | $17,500 | -- |
Source: Public Records
Mortgage History
| Date | Status | Borrower | Loan Amount |
|---|---|---|---|
| Open | Taylor Robert | $136,482 | |
| Previous Owner | Taylor Mallory E | $116,885 |
Source: Public Records
Tax History Compared to Growth
Tax History
| Year | Tax Paid | Tax Assessment Tax Assessment Total Assessment is a certain percentage of the fair market value that is determined by local assessors to be the total taxable value of land and additions on the property. | Land | Improvement |
|---|---|---|---|---|
| 2025 | $1,510 | $17,334 | $3,033 | $14,301 |
| 2024 | $1,463 | $16,828 | $2,944 | $13,884 |
| 2023 | $1,463 | $16,338 | $2,880 | $13,458 |
| 2022 | $1,376 | $15,863 | $2,750 | $13,113 |
| 2021 | $1,272 | $15,401 | $2,750 | $12,651 |
| 2020 | $1,133 | $13,649 | $2,200 | $11,449 |
| 2019 | $1,110 | $12,985 | $2,200 | $10,785 |
| 2018 | $1,142 | $13,357 | $2,200 | $11,157 |
| 2017 | $1,216 | $13,245 | $2,200 | $11,045 |
| 2016 | $1,225 | $14,049 | $2,200 | $11,849 |
| 2015 | $1,181 | $13,734 | $2,200 | $11,534 |
| 2014 | $1,144 | $13,335 | $2,200 | $11,135 |
Source: Public Records
Map
Nearby Homes
- 817 W 24th St N
- 825 W 23rd St N
- 809 W 24th St N
- 1005 W 23rd St
- 1012 W 22nd St
- 1110 W 24th St N
- 2403 N Jay St
- 1908 N Chambers Terrace
- 1103 W 20th St
- 1112 W 20th St
- 1907 N Chambers Ave
- 1404 Oakhurst Cir
- 1505 Cedarwood Dr
- 1504 Cedarwood Dr
- 1503 Cedarwood Dr
- 1506 Cedarwood Dr
- 1605 Pinecrest Dr
- 1603 Pinecrest Dr
- 1507 Cedarwood Dr
- 1509 Pinecrest Dr
- 843 W 23rd St N
- 843 W 23rd St N
- 841 W 23rd St
- 841 W 23rd St N
- 1114 W 23rd St N
- 1004 W 23rd St N
- 1012 W 23rd St N
- 842 W 24th St N
- 2104 N Chambers Terrace
- 2106 N Chambers Terrace
- 826 W 23rd St N
- 2200 N Chambers Terrace
- 839 W 23rd St N
- 840 W 24th St N
- 825 W 24th St N
- 2202 N Chambers Terrace
- 824 W 23rd St N
- 837 W 23rd St N
- 2100 N Chambers Terrace
- 835 W 23rd St N