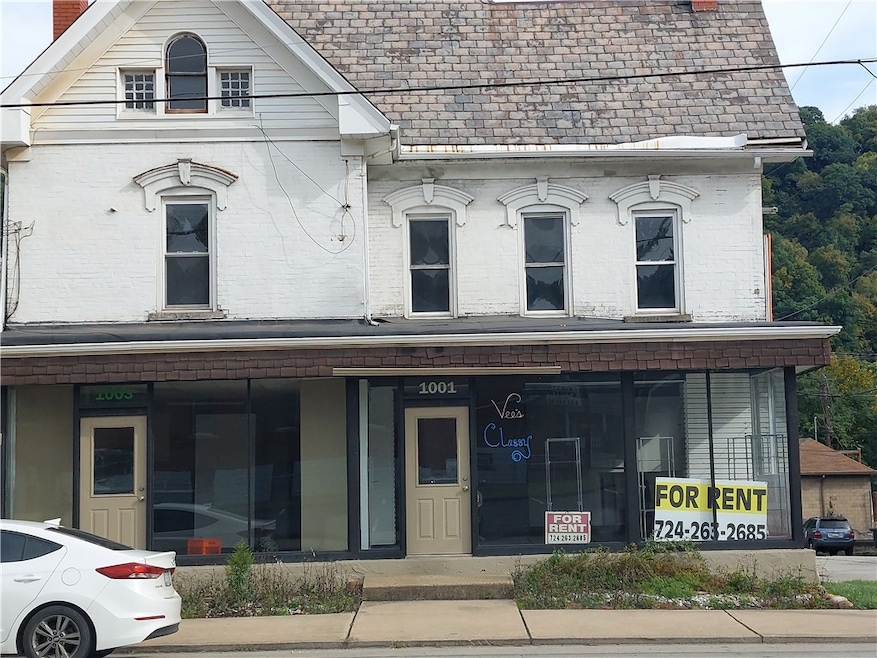
1001 W Main St Monongahela, PA 15063
Estimated payment $1,105/month
About This Home
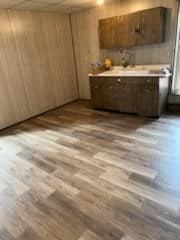
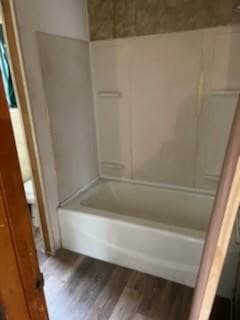
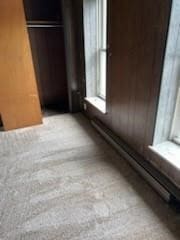
Store front is 1400 SQ, ft, +/- according to county records. This includes back room storage space and 1/2 bath. Store front can be divided into 2 units with each having own street facing entrance. Apartments are both one bedroom one bath. Separate utilities for apartments and the store front as one unit. Store front is currently available if potential purchaser needs to use it for business opportunity.
Property Details
Home Type
- Multi-Family
Est. Annual Taxes
- $2,168
Year Built
- Built in 1900
Lot Details
- 2,614 Sq Ft Lot
- Lot Dimensions are 51x50
Parking
- On-Street Parking
Home Design
- Brick Exterior Construction
- Asbestos Shingle Roof
Basement
- Basement Fills Entire Space Under The House
Community Details
- 3 Units
- Public Transportation
- Gross Income $18,000
Map
Home Values in the Area
Average Home Value in this Area
Tax History
| Year | Tax Paid | Tax Assessment Tax Assessment Total Assessment is a certain percentage of the fair market value that is determined by local assessors to be the total taxable value of land and additions on the property. | Land | Improvement |
|---|---|---|---|---|
| 2025 | $2,374 | $82,300 | $12,400 | $69,900 |
| 2024 | $2,025 | $82,300 | $12,400 | $69,900 |
| 2023 | $2,025 | $82,300 | $12,400 | $69,900 |
| 2022 | $1,992 | $82,300 | $12,400 | $69,900 |
| 2021 | $1,971 | $82,300 | $12,400 | $69,900 |
| 2020 | $1,938 | $82,300 | $12,400 | $69,900 |
| 2019 | $1,922 | $82,300 | $12,400 | $69,900 |
| 2018 | $1,864 | $82,300 | $12,400 | $69,900 |
| 2017 | $135 | $82,300 | $12,400 | $69,900 |
| 2016 | $135 | $5,402 | $1,470 | $3,932 |
| 2015 | -- | $5,402 | $1,470 | $3,932 |
| 2014 | $135 | $5,402 | $1,470 | $3,932 |
| 2013 | $135 | $5,402 | $1,470 | $3,932 |
Property History
| Date | Event | Price | List to Sale | Price per Sq Ft |
|---|---|---|---|---|
| 10/11/2025 10/11/25 | For Sale | $175,000 | -- | -- |
Purchase History
| Date | Type | Sale Price | Title Company |
|---|---|---|---|
| Deed | $127,000 | Commonwealth Abstract & Clos | |
| Sheriffs Deed | $1,230 | None Available |
Mortgage History
| Date | Status | Loan Amount | Loan Type |
|---|---|---|---|
| Open | $255,000 | Purchase Money Mortgage |
Source: West Penn Multi-List
MLS Number: 1725015
APN: 4400070002000700
Disclaimer: Certain information contained herein is derived from information provided by parties other than Homes.com. All information provided is deemed reliable, but is not guaranteed to be accurate and should be independently verified.
![]() IDX information is provided exclusively for personal, non-commercial use, and may not be used for any purpose other than to identify prospective properties consumers may be interested in purchasing.
IDX information is provided exclusively for personal, non-commercial use, and may not be used for any purpose other than to identify prospective properties consumers may be interested in purchasing.
Information is deemed reliable but not guaranteed.
- 514 4th St Unit 512
- 500 Highland Ave
- 435 Donner Ave
- 619 Conrad Ave Unit 2
- 623 Conrad Ave
- 418 Short St
- 516 Oneida St
- 3115 School Place
- 501 3rd Ave Unit 501
- 16 3rd St
- 302 1st St
- 108 Ellsworth Ave
- 12 Young Ln
- 929 Vankirk St Unit 1
- 927 Vankirk St
- 922 Vankirk St Unit 1
- 549 Thompson Ave
- 877 Vankirk St
- 2701 Lincoln Ave
- 855 Vankirk St Unit 1
