
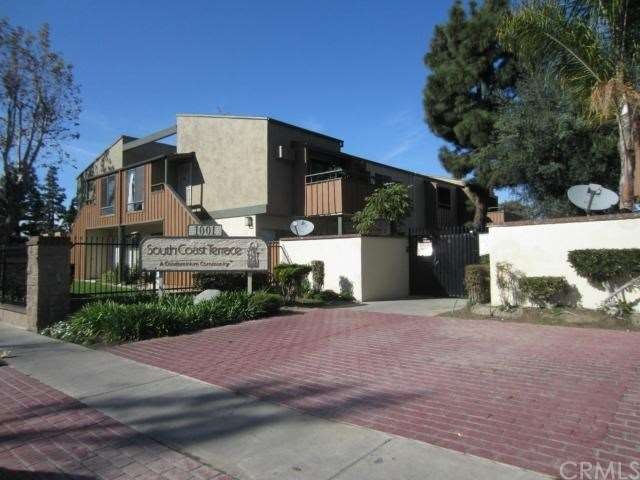
1001 W Stevens Ave Unit 211 Santa Ana, CA 92707
South Coast Neighborhood
2
Beds
2
Baths
866
Sq Ft
$429/mo
HOA Fee
Highlights
- Private Pool
- Living Room
- Wall Furnace
- Cooling System Mounted To A Wall/Window
- Greenbelt
About This Home
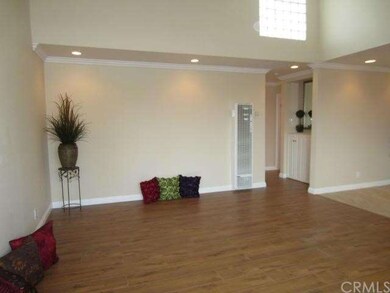
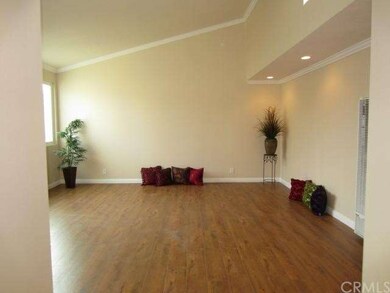
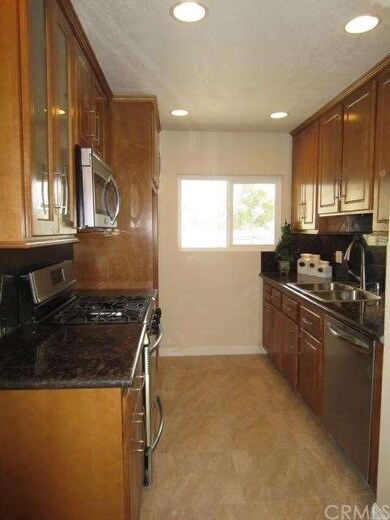
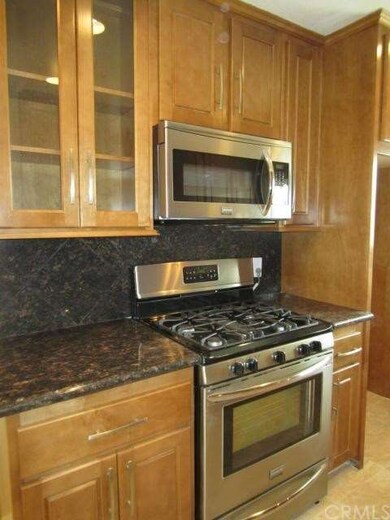
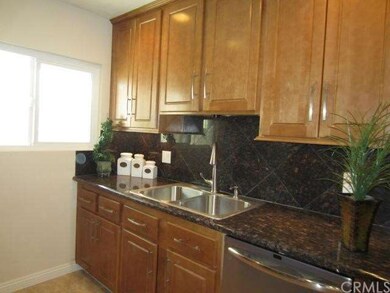
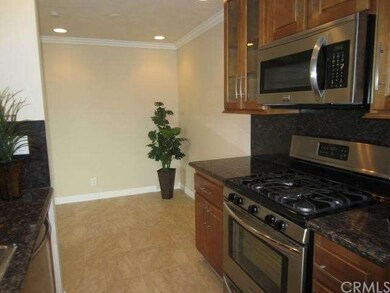
As of August 2017Absolutely beautiful Condo situated in a most desirable area. Completely remodeled home features 2 Bedrooms, 2 Baths within gated community. New interior paint, new wood floorings throughout, new tile in kitchen and all bathrooms, new stainless steal appliances, new light fixtures, new recessed lightings throughout, new crown moldings, and base boards, new bathrooms, new dual pane windows, new designers custom mirrors, new AC, new Heater. This home is within walking distance from South Coast Mall and Performing Arts Center. Gated community with pools, spa and clubhouse. This is a MUST see home, you will not be disappointed.
Property Details
Home Type
- Condominium
Est. Annual Taxes
- $4,066
Year Built
- Built in 1972
HOA Fees
- $429 Monthly HOA Fees
Interior Spaces
- 866 Sq Ft Home
- Entryway
- Living Room
Bedrooms and Bathrooms
- 2 Bedrooms
- 2 Full Bathrooms
Parking
- 1 Parking Space
- 1 Carport Space
Pool
- Private Pool
- Spa
Utilities
- Cooling System Mounted To A Wall/Window
- Wall Furnace
Additional Features
- Two or More Common Walls
- Suburban Location
Listing and Financial Details
- Tax Lot 1
- Tax Tract Number 10158
- Assessor Parcel Number 93041511
Community Details
Overview
- 251 Units
- Greenbelt
Recreation
- Community Pool
- Community Spa
Ownership History
Date
Name
Owned For
Owner Type
Purchase Details
Closed on
Oct 18, 2024
Sold by
Latorre Elizabeth
Bought by
Socal Civil Golf Llc
Current Estimated Value
Purchase Details
Listed on
Jul 4, 2017
Closed on
Aug 2, 2017
Sold by
Gutierreez Yvette
Bought by
Estenger Guillermo and Latorre Elizabeth
Seller's Agent
Julio Arana Cortes
Realty One Group West
Buyer's Agent
Julio Arana Cortes
Realty One Group West
List Price
$289,000
Sold Price
$297,000
Premium/Discount to List
$8,000
2.77%
Home Financials for this Owner
Home Financials are based on the most recent Mortgage that was taken out on this home.
Avg. Annual Appreciation
5.58%
Original Mortgage
$237,200
Interest Rate
3.9%
Mortgage Type
New Conventional
Purchase Details
Listed on
Feb 17, 2014
Closed on
Feb 26, 2014
Sold by
Quest Ira Inc
Bought by
Gutierrez Yvette
Seller's Agent
Jenny Vu
Coldwell Banker Realty
Buyer's Agent
Jenny Vu
Coldwell Banker Realty
List Price
$199,000
Sold Price
$228,000
Premium/Discount to List
$29,000
14.57%
Home Financials for this Owner
Home Financials are based on the most recent Mortgage that was taken out on this home.
Avg. Annual Appreciation
8.09%
Original Mortgage
$182,400
Interest Rate
4.29%
Mortgage Type
New Conventional
Purchase Details
Listed on
Nov 26, 2013
Closed on
Nov 1, 2013
Sold by
Lopez Cesar
Bought by
Quest Ira Inc and Robert Hrifko Ira #1490211
Seller's Agent
Jenny Vu
Coldwell Banker Realty
Buyer's Agent
Hoa Cao
L.S. Gateway Realtors
List Price
$106,400
Sold Price
$127,800
Premium/Discount to List
$21,400
20.11%
Home Financials for this Owner
Home Financials are based on the most recent Mortgage that was taken out on this home.
Avg. Annual Appreciation
588.67%
Purchase Details
Closed on
Dec 3, 1999
Sold by
Maria Ortiz
Bought by
Lopez Cesar
Home Financials for this Owner
Home Financials are based on the most recent Mortgage that was taken out on this home.
Original Mortgage
$97,552
Interest Rate
7.84%
Mortgage Type
FHA
Purchase Details
Closed on
Jan 30, 1996
Sold by
Hud
Bought by
Ortiz Maria and Rodriguez Arturo
Home Financials for this Owner
Home Financials are based on the most recent Mortgage that was taken out on this home.
Original Mortgage
$70,900
Interest Rate
7.01%
Mortgage Type
FHA
Purchase Details
Closed on
Aug 8, 1995
Sold by
Howard Grant and Howard Mari Margaret
Bought by
National Pacific Mtg Corp
Purchase Details
Closed on
Mar 4, 1995
Sold by
Ortiz Santiago
Bought by
Ortiz Maria
Purchase Details
Closed on
Dec 7, 1994
Sold by
Howard Grant and Howard Mari Margaret
Bought by
Slaw Inc
Similar Homes in the area
Create a Home Valuation Report for This Property
The Home Valuation Report is an in-depth analysis detailing your home's value as well as a comparison with similar homes in the area
Home Values in the Area
Average Home Value in this Area
Purchase History
| Date | Type | Sale Price | Title Company |
|---|---|---|---|
| Quit Claim Deed | -- | None Listed On Document | |
| Quit Claim Deed | -- | None Listed On Document | |
| Quit Claim Deed | -- | None Listed On Document | |
| Grant Deed | $296,500 | First American Title O | |
| Grant Deed | -- | First American Title Co | |
| Grant Deed | $228,000 | First American Title Company | |
| Grant Deed | -- | First American Title Company | |
| Grant Deed | $100,000 | Fidelity National Title Ins | |
| Grant Deed | -- | Fidelity National Title Ins | |
| Grant Deed | $71,000 | -- | |
| Trustee Deed | $109,321 | American Title Ins Co | |
| Interfamily Deed Transfer | -- | -- | |
| Grant Deed | -- | -- |
Source: Public Records
Mortgage History
| Date | Status | Loan Amount | Loan Type |
|---|---|---|---|
| Previous Owner | $237,200 | New Conventional | |
| Previous Owner | $182,400 | New Conventional | |
| Previous Owner | $217,000 | New Conventional | |
| Previous Owner | $78,000 | Credit Line Revolving | |
| Previous Owner | $49,000 | Credit Line Revolving | |
| Previous Owner | $126,000 | Unknown | |
| Previous Owner | $30,700 | Credit Line Revolving | |
| Previous Owner | $112,000 | Unknown | |
| Previous Owner | $97,552 | FHA | |
| Previous Owner | $70,900 | FHA |
Source: Public Records
Property History
| Date | Event | Price | Change | Sq Ft Price |
|---|---|---|---|---|
| 08/08/2017 08/08/17 | Sold | $297,000 | +2.8% | $342 / Sq Ft |
| 07/10/2017 07/10/17 | Pending | -- | -- | -- |
| 07/04/2017 07/04/17 | For Sale | $289,000 | +26.8% | $333 / Sq Ft |
| 03/17/2014 03/17/14 | Sold | $228,000 | +14.6% | $263 / Sq Ft |
| 02/17/2014 02/17/14 | For Sale | $199,000 | -12.7% | $230 / Sq Ft |
| 02/14/2014 02/14/14 | Off Market | $228,000 | -- | -- |
| 02/08/2014 02/08/14 | For Sale | $199,000 | +55.7% | $230 / Sq Ft |
| 11/27/2013 11/27/13 | Sold | $127,800 | +20.1% | $148 / Sq Ft |
| 11/26/2013 11/26/13 | For Sale | $106,400 | -16.7% | $123 / Sq Ft |
| 07/24/2013 07/24/13 | Off Market | $127,800 | -- | -- |
| 07/24/2013 07/24/13 | For Sale | $70,000 | 0.0% | $81 / Sq Ft |
| 07/24/2013 07/24/13 | Price Changed | $70,000 | -45.2% | $81 / Sq Ft |
| 11/09/2012 11/09/12 | Off Market | $127,800 | -- | -- |
| 11/09/2012 11/09/12 | For Sale | $106,400 | -16.7% | $123 / Sq Ft |
| 10/27/2012 10/27/12 | Off Market | $127,800 | -- | -- |
| 10/27/2012 10/27/12 | For Sale | $106,400 | -16.7% | $123 / Sq Ft |
| 09/06/2012 09/06/12 | Off Market | $127,800 | -- | -- |
| 08/16/2012 08/16/12 | Price Changed | $106,400 | -5.0% | $123 / Sq Ft |
| 07/16/2012 07/16/12 | For Sale | $112,000 | -12.4% | $129 / Sq Ft |
| 07/13/2012 07/13/12 | Off Market | $127,800 | -- | -- |
| 07/10/2012 07/10/12 | Price Changed | $112,000 | +80.6% | $129 / Sq Ft |
| 06/08/2012 06/08/12 | For Sale | $62,000 | -51.5% | $72 / Sq Ft |
| 05/12/2012 05/12/12 | Off Market | $127,800 | -- | -- |
| 05/11/2012 05/11/12 | Price Changed | $75,000 | -28.6% | $87 / Sq Ft |
| 04/30/2012 04/30/12 | Price Changed | $105,000 | +40.0% | $121 / Sq Ft |
| 04/06/2012 04/06/12 | For Sale | $75,000 | -41.3% | $87 / Sq Ft |
| 04/05/2012 04/05/12 | Off Market | $127,800 | -- | -- |
| 04/04/2012 04/04/12 | Price Changed | $75,000 | -21.1% | $87 / Sq Ft |
| 02/24/2012 02/24/12 | For Sale | $95,000 | -25.7% | $110 / Sq Ft |
| 02/17/2012 02/17/12 | Off Market | $127,800 | -- | -- |
| 02/14/2012 02/14/12 | For Sale | $95,000 | -- | $110 / Sq Ft |
Source: California Regional Multiple Listing Service (CRMLS)
Tax History Compared to Growth
Tax History
| Year | Tax Paid | Tax Assessment Tax Assessment Total Assessment is a certain percentage of the fair market value that is determined by local assessors to be the total taxable value of land and additions on the property. | Land | Improvement |
|---|---|---|---|---|
| 2025 | $4,066 | $450,000 | $383,468 | $66,532 |
| 2024 | $4,066 | $330,749 | $276,259 | $54,490 |
| 2023 | $3,964 | $324,264 | $270,842 | $53,422 |
| 2022 | $3,922 | $317,906 | $265,531 | $52,375 |
| 2021 | $3,831 | $311,673 | $260,324 | $51,349 |
| 2020 | $3,838 | $308,478 | $257,655 | $50,823 |
| 2019 | $3,764 | $302,430 | $252,603 | $49,827 |
| 2018 | $3,546 | $296,500 | $247,650 | $48,850 |
| 2017 | $2,957 | $240,823 | $187,098 | $53,725 |
| 2016 | $2,898 | $236,101 | $183,429 | $52,672 |
| 2015 | $2,860 | $232,555 | $180,674 | $51,881 |
| 2014 | $2,237 | $170,000 | $121,798 | $48,202 |
Source: Public Records
Agents Affiliated with this Home
-
Julio Arana Cortes
Seller's Agent in 2017
Julio Arana Cortes
Realty One Group West
(714) 675-4042
2 in this area
95 Total Sales
-
Jenny Vu
J
Seller's Agent in 2014
Jenny Vu
Coldwell Banker Realty
(714) 894-3477
12 Total Sales
-
H
Buyer's Agent in 2013
Hoa Cao
L.S. Gateway Realtors
Map
Source: California Regional Multiple Listing Service (CRMLS)
MLS Number: PW14027165
APN: 930-415-11
Disclaimer: Certain information contained herein is derived from information provided by parties other than Homes.com. All information provided is deemed reliable, but is not guaranteed to be accurate and should be independently verified.
![]() The multiple listing data appearing on this website, or contained in reports produced therefrom, is owned and copyrighted by California Regional Multiple Listing Service, Inc. ("CRMLS") and is protected by all applicable copyright laws. Information provided is for viewer's personal, non-commercial use and may not be used for any purpose other than to identify prospective properties the viewer may be interested in purchasing. All listing data, including but not limited to square footage and lot size is believed to be accurate, but the listing Agent, listing Broker and CRMLS and its affiliates do not warrant or guarantee such accuracy. The viewer should independently verify the listed data prior to making any decisions based on such information by personal inspection and/or contacting a real estate professional.
The multiple listing data appearing on this website, or contained in reports produced therefrom, is owned and copyrighted by California Regional Multiple Listing Service, Inc. ("CRMLS") and is protected by all applicable copyright laws. Information provided is for viewer's personal, non-commercial use and may not be used for any purpose other than to identify prospective properties the viewer may be interested in purchasing. All listing data, including but not limited to square footage and lot size is believed to be accurate, but the listing Agent, listing Broker and CRMLS and its affiliates do not warrant or guarantee such accuracy. The viewer should independently verify the listed data prior to making any decisions based on such information by personal inspection and/or contacting a real estate professional.
Based on information from California Regional Multiple Listing Service, Inc. and /or other sources. All data, including all measurements and calculations of area, is obtained from various sources and has not been, and will not be, verified by broker or MLS. All information should be independently reviewed and verified for accuracy. Properties may or may not be listed by the office/agent presenting the information
Nearby Homes
- 1001 W Stevens Ave Unit 319
- 1001 W Stevens Ave Unit 129
- 1001 W Stevens Ave Unit 184
- 1001 W Stevens Ave Unit 202
- 1010 W Macarthur Blvd Unit 24
- 1010 W Macarthur Blvd Unit 8
- 1010 W Macarthur Blvd Unit 16
- 1030 W Macarthur Blvd Unit 95
- 1030 W Macarthur Blvd Unit 83
- 1000 W Macarthur Blvd Unit 44
- 1000 W Macarthur Blvd Unit 100
- 1000 W Macarthur Blvd Unit 13
- 1000 W Macarthur Blvd Unit 3
- 1000 W Macarthur Blvd Unit 67
- 3614 S Olive St
- 1040 W Macarthur Blvd Unit 35
- 3718 S Garnsey St
- 1101 W Macarthur Blvd Unit 304
- 414 Nobel Ave Unit D
- 3626 S Garnsey St