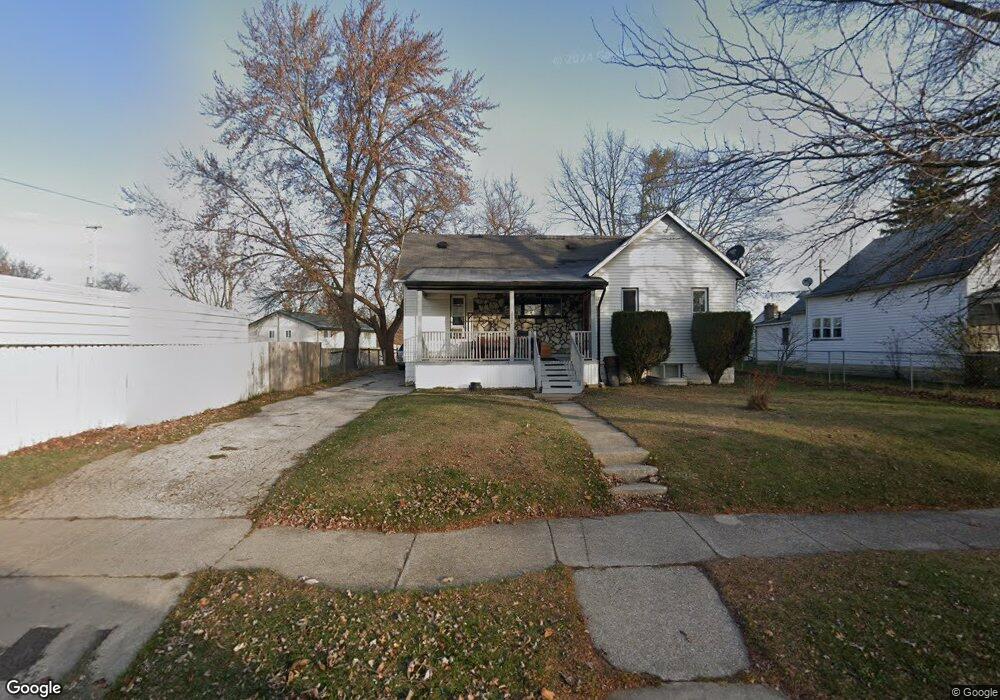
1001 Webber St Saginaw, MI 48601
Estimated Value: $43,683 - $62,000
3
Beds
1
Bath
1,059
Sq Ft
$49/Sq Ft
Est. Value
About This Home
This home is located at 1001 Webber St, Saginaw, MI 48601 and is currently estimated at $51,671, approximately $48 per square foot. 1001 Webber St is a home located in Saginaw County with nearby schools including Jessie Rouse Elementary School, Thompson Middle School, and Saginaw United High School.
Ownership History
Date
Name
Owned For
Owner Type
Purchase Details
Closed on
Apr 8, 2010
Sold by
Dept Of Veterans Affairs
Bought by
Witherspoon Walter E
Current Estimated Value
Purchase Details
Closed on
Jun 19, 2009
Sold by
Baker Kenneth and Smith Vertis
Bought by
Veterans Affairs
Purchase Details
Closed on
Sep 19, 2002
Sold by
Dnr-02
Bought by
Smith Vertis P and Baker Kenneth E
Purchase Details
Closed on
Mar 22, 2002
Sold by
Staton Vicki Lynn
Bought by
Dnr-02
Purchase Details
Closed on
Feb 10, 1998
Sold by
Ceja Hector
Bought by
Staton Vicki Lynn
Purchase Details
Closed on
Dec 22, 1994
Sold by
Staton Vicki Lynn
Bought by
Staton Vicki Lynn and Ceja Hector
Purchase Details
Closed on
Jun 8, 1993
Sold by
Staton Larry
Bought by
Staton Vicki Lynn
Purchase Details
Closed on
Jul 1, 1981
Sold by
Salas Manuel and Salas Lupe
Bought by
Staton Larry and Staton Vicki
Purchase Details
Closed on
Jan 10, 1980
Sold by
Bartlett Claude and Bartlett Edna
Bought by
Salas Manuel M and Salas Lupe
Create a Home Valuation Report for This Property
The Home Valuation Report is an in-depth analysis detailing your home's value as well as a comparison with similar homes in the area
Home Values in the Area
Average Home Value in this Area
Purchase History
| Date | Buyer | Sale Price | Title Company |
|---|---|---|---|
| Witherspoon Walter E | $5,000 | -- | |
| Veterans Affairs | $12,000 | -- | |
| Smith Vertis P | $9,800 | -- | |
| Baker Kenneth | $33,300 | -- | |
| Dnr-02 | -- | -- | |
| Staton Vicki Lynn | -- | -- | |
| Staton Vicki Lynn | -- | -- | |
| Staton Vicki Lynn | -- | -- | |
| Staton Larry | $20,500 | -- | |
| Salas Manuel M | $11,500 | -- |
Source: Public Records
Tax History Compared to Growth
Tax History
| Year | Tax Paid | Tax Assessment Tax Assessment Total Assessment is a certain percentage of the fair market value that is determined by local assessors to be the total taxable value of land and additions on the property. | Land | Improvement |
|---|---|---|---|---|
| 2025 | $730 | $16,600 | $0 | $0 |
| 2024 | $597 | $14,900 | $0 | $0 |
| 2023 | $573 | $13,900 | $0 | $0 |
| 2022 | $670 | $11,700 | $0 | $0 |
| 2021 | $630 | $9,200 | $0 | $0 |
| 2020 | $568 | $8,800 | $0 | $0 |
| 2019 | $570 | $8,300 | $500 | $7,800 |
| 2018 | $490 | $8,880 | $0 | $0 |
| 2017 | $578 | $8,950 | $0 | $0 |
| 2016 | $574 | $8,880 | $0 | $0 |
| 2014 | -- | $9,066 | $0 | $8,512 |
| 2013 | -- | $9,109 | $0 | $0 |
Source: Public Records
Map
Nearby Homes
- 2015 S Washington Ave
- 521 Birch St
- 2511 Wilkins St
- 2514 Thayer St
- 0 Randolph St
- 313 Birch St
- 2205 Owen St
- 1615 Webber St
- 2610 S Jefferson Ave
- 1940 Robinwood Ave
- 2206 Robinwood Ave
- 2723 Owen St
- 2938 Salina St
- 1928 Parkwood Ave
- 1526 Owen St
- 3006 Douglass St
- 1624 Cedar St
- 3137 S Washington Ave
- 2126 Maplewood Ave
- 2403 Troy St