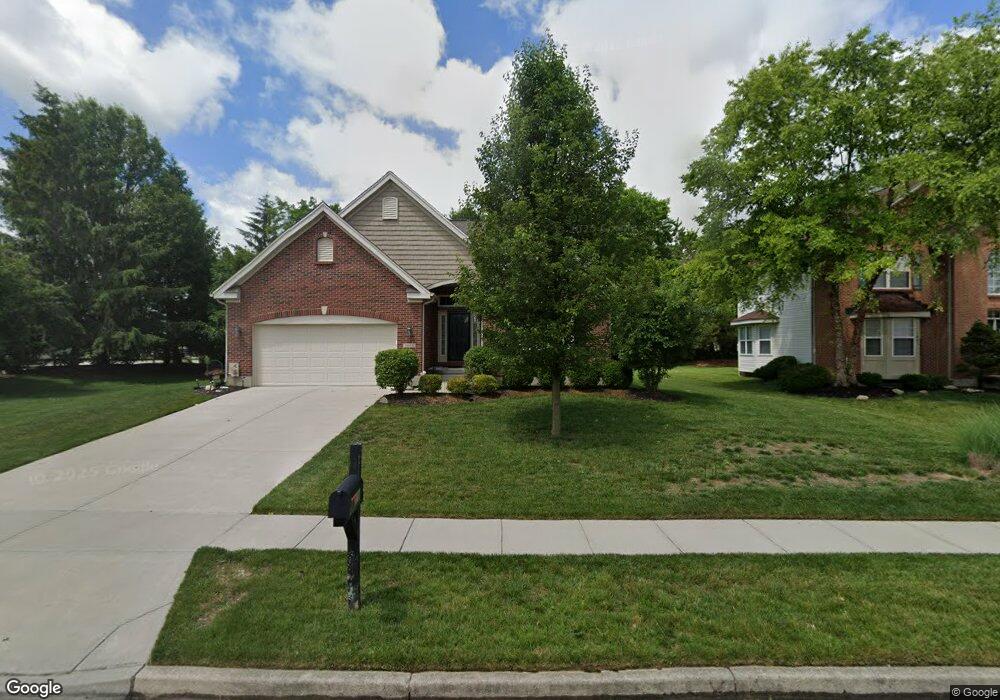
1001 Windpointe Way Englewood, OH 45322
Estimated Value: $342,000 - $424,000
4
Beds
4
Baths
2,159
Sq Ft
$175/Sq Ft
Est. Value
About This Home
This home is located at 1001 Windpointe Way, Englewood, OH 45322 and is currently estimated at $378,641, approximately $175 per square foot. 1001 Windpointe Way is a home with nearby schools including Salem Christian Academy.
Ownership History
Date
Name
Owned For
Owner Type
Purchase Details
Closed on
Dec 12, 2024
Sold by
Pemberton Jason T and Pemberton Carrie A
Bought by
Pemberton Family Revocable Living Trust and Pemberton
Current Estimated Value
Purchase Details
Closed on
Feb 24, 2015
Sold by
Inverness Group Inc
Bought by
Pemberton Jason T and Pemberton Carrie A
Purchase Details
Closed on
Nov 6, 2008
Sold by
Windpointe Development Co Llc
Bought by
Inverness Group Inc
Home Financials for this Owner
Home Financials are based on the most recent Mortgage that was taken out on this home.
Original Mortgage
$15,000,000
Interest Rate
6.04%
Mortgage Type
Credit Line Revolving
Create a Home Valuation Report for This Property
The Home Valuation Report is an in-depth analysis detailing your home's value as well as a comparison with similar homes in the area
Home Values in the Area
Average Home Value in this Area
Purchase History
| Date | Buyer | Sale Price | Title Company |
|---|---|---|---|
| Pemberton Family Revocable Living Trust | -- | None Listed On Document | |
| Pemberton Jason T | $264,800 | Sterling Title Inc | |
| Inverness Group Inc | -- | None Available |
Source: Public Records
Mortgage History
| Date | Status | Borrower | Loan Amount |
|---|---|---|---|
| Previous Owner | Inverness Group Inc | $15,000,000 |
Source: Public Records
Tax History Compared to Growth
Tax History
| Year | Tax Paid | Tax Assessment Tax Assessment Total Assessment is a certain percentage of the fair market value that is determined by local assessors to be the total taxable value of land and additions on the property. | Land | Improvement |
|---|---|---|---|---|
| 2024 | $5,467 | $96,080 | $13,350 | $82,730 |
| 2023 | $5,467 | $96,080 | $13,350 | $82,730 |
| 2022 | $6,509 | $88,140 | $12,250 | $75,890 |
| 2021 | $6,528 | $88,140 | $12,250 | $75,890 |
| 2020 | $6,407 | $88,140 | $12,250 | $75,890 |
| 2019 | $6,142 | $75,750 | $13,480 | $62,270 |
| 2018 | $6,030 | $75,750 | $13,480 | $62,270 |
| 2017 | $5,967 | $75,750 | $13,480 | $62,270 |
| 2016 | $5,450 | $67,680 | $12,250 | $55,430 |
| 2015 | $739 | $39,960 | $12,250 | $27,710 |
| 2014 | $739 | $9,800 | $9,800 | $0 |
| 2012 | -- | $10,500 | $10,500 | $0 |
Source: Public Records
Map
Nearby Homes
- 86 Scott Dr
- 8849 Meiring St
- 4784 Molunat
- 318 Shady Tree Ct
- 325 Beechgrove Dr
- 306 Pauly Dr
- 111 Denwood Trail
- 4245 W Wenger Rd
- 332 Beckenham Rd
- 322 Rankin Dr
- 114 Brumbaugh Ct
- 918 Sunset Dr
- Chatham Plan at Wenger Village
- Milford Plan at Wenger Village
- Holcombe Plan at Wenger Village
- Newcastle Plan at Wenger Village
- Pendleton Plan at Wenger Village
- Bellamy Plan at Wenger Village
- Henley Plan at Wenger Village
- 900 Moonlight Dr
- 1003 Windpointe Way
- 1005 Windpointe Way
- 400 Whisperwood Dr
- 3901 National Rd
- 1007 Windpointe Way
- 402 Whisperwood Dr
- 1006 Windpointe Way
- 1009 Windpointe Way
- 3945 National Rd
- 404 Whisperwood Dr
- 403 Whisperwood Dr
- 1008 Windpointe Way
- 1011 Windpointe Way
- 405 Whisperwood Dr
- 406 Whisperwood Dr
- 3957 National Rd
- 407 Whisperwood Dr
- 202 Pointers Run
- 1013 Windpointe Way
- 104 Winterberry Place