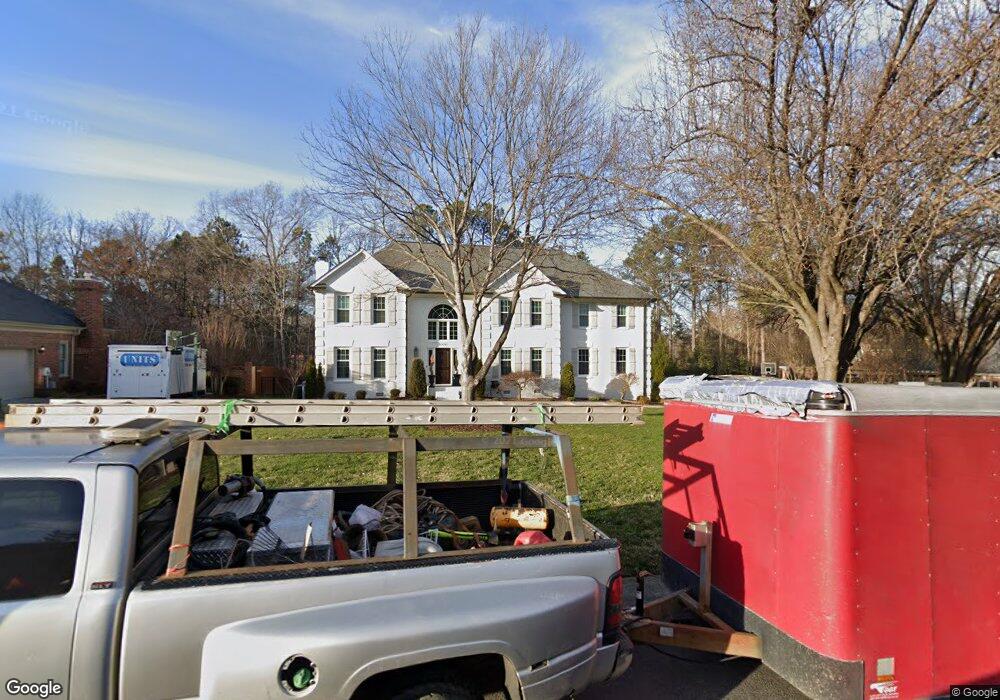
10010 Berkeley Forest Ln Charlotte, NC 28277
Providence NeighborhoodEstimated Value: $870,000 - $957,000
4
Beds
3
Baths
2,734
Sq Ft
$333/Sq Ft
Est. Value
About This Home
This home is located at 10010 Berkeley Forest Ln, Charlotte, NC 28277 and is currently estimated at $910,172, approximately $332 per square foot. 10010 Berkeley Forest Ln is a home located in Mecklenburg County with nearby schools including Providence Spring Elementary, Jay M Robinson Middle School, and Providence High.
Ownership History
Date
Name
Owned For
Owner Type
Purchase Details
Closed on
Apr 25, 2013
Sold by
Taefl William T
Bought by
Taefi William T and Taefi Addison
Current Estimated Value
Home Financials for this Owner
Home Financials are based on the most recent Mortgage that was taken out on this home.
Original Mortgage
$300,000
Outstanding Balance
$213,477
Interest Rate
3.65%
Mortgage Type
New Conventional
Estimated Equity
$696,695
Purchase Details
Closed on
Jun 14, 2012
Sold by
Pittman George E and Pittman Mary Lynette
Bought by
Taefi William T
Home Financials for this Owner
Home Financials are based on the most recent Mortgage that was taken out on this home.
Original Mortgage
$308,302
Interest Rate
3.84%
Mortgage Type
FHA
Purchase Details
Closed on
Oct 17, 1990
Bought by
Pittman George E
Create a Home Valuation Report for This Property
The Home Valuation Report is an in-depth analysis detailing your home's value as well as a comparison with similar homes in the area
Home Values in the Area
Average Home Value in this Area
Purchase History
| Date | Buyer | Sale Price | Title Company |
|---|---|---|---|
| Taefi William T | -- | None Available | |
| Taefi William T | $330,000 | None Available | |
| Pittman George E | $207,500 | -- |
Source: Public Records
Mortgage History
| Date | Status | Borrower | Loan Amount |
|---|---|---|---|
| Open | Taefi William T | $300,000 | |
| Previous Owner | Taefi William T | $308,302 |
Source: Public Records
Tax History Compared to Growth
Tax History
| Year | Tax Paid | Tax Assessment Tax Assessment Total Assessment is a certain percentage of the fair market value that is determined by local assessors to be the total taxable value of land and additions on the property. | Land | Improvement |
|---|---|---|---|---|
| 2025 | $5,735 | $737,100 | $175,000 | $562,100 |
| 2024 | $5,735 | $737,100 | $175,000 | $562,100 |
| 2023 | $5,546 | $737,100 | $175,000 | $562,100 |
| 2022 | $4,947 | $499,600 | $115,000 | $384,600 |
| 2021 | $4,936 | $499,600 | $115,000 | $384,600 |
| 2020 | $4,928 | $466,900 | $115,000 | $351,900 |
| 2019 | $4,597 | $466,900 | $115,000 | $351,900 |
| 2018 | $5,080 | $381,600 | $85,000 | $296,600 |
| 2017 | $5,002 | $381,600 | $85,000 | $296,600 |
| 2016 | $4,993 | $371,600 | $85,000 | $286,600 |
| 2015 | $4,852 | $371,600 | $85,000 | $286,600 |
| 2014 | $4,835 | $371,600 | $85,000 | $286,600 |
Source: Public Records
Map
Nearby Homes
- 10030 Berkeley Forest Ln
- 5123 Berkeley Park Ct
- 10224 Berkeley Pond Dr
- 5912 Alexa Rd
- 5672 Wrenfield Ct
- 10016 Whitethorn Dr
- 7028 Henry Quincy Way
- 5410 Shannon Bell Ln
- 9522 Greyson Heights Dr
- 8928 Saint Croix Ln
- 9514 Fairway Ridge Rd
- 9305 Four Mile Creek Rd
- 9114 Arbourgate Meadows Ln
- 9116 Arbourgate Meadows Ln
- 10512 Roseberry Ct
- 3415 Lakeside Dr
- 9104 Four Mile Creek Rd
- 8159 Circle Tree Ln
- 9426 Greyson Ridge Dr
- 10527 Breamore Dr
- 10018 Berkeley Forest Ln
- 10000 Berkeley Forest Ln
- 10001 Berkeley Forest Ln
- 10024 Berkeley Forest Ln
- 10011 Berkeley Forest Ln
- 10017 Berkeley Forest Ln
- 10005 Berkeley Forest Ln
- 10035 Berkeley Forest Ln
- 10034 Berkeley Forest Ln
- 10047 Berkeley Forest Ln
- 10040 Berkeley Forest Ln
- 10053 Berkeley Forest Ln
- 5762 Summerston Place
- 5802 Summerston Place
- 10048 Berkeley Forest Ln
- 5758 Summerston Place
- 5304 Rockhill Ln
- 10100 Waterbrook Ln
- 5144 Berkeley Park Ct
- 5754 Summerston Place