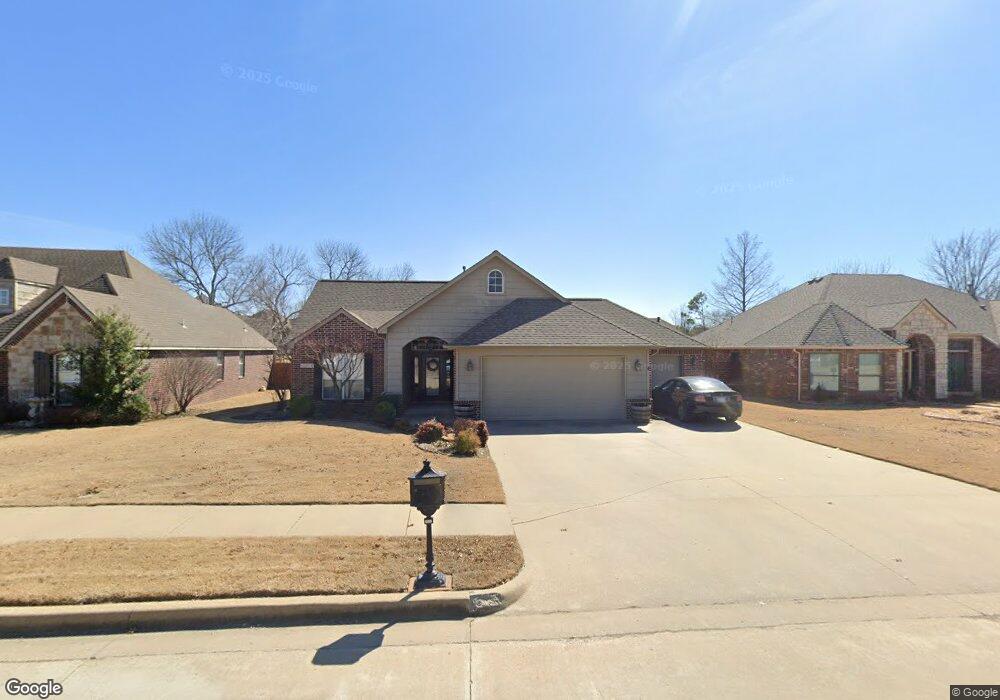
10010 E 123rd St S Bixby, OK 74008
North Bixby NeighborhoodEstimated Value: $284,000 - $331,000
3
Beds
3
Baths
2,024
Sq Ft
$153/Sq Ft
Est. Value
About This Home
This home is located at 10010 E 123rd St S, Bixby, OK 74008 and is currently estimated at $308,848, approximately $152 per square foot. 10010 E 123rd St S is a home located in Tulsa County with nearby schools including Bixby East Elementary, Bixby Middle School, and Bixby High School.
Ownership History
Date
Name
Owned For
Owner Type
Purchase Details
Closed on
Oct 6, 2006
Sold by
Cooper Bill R and Cooper Sherry L
Bought by
Martin Randal M and Martin Daniel Erica
Current Estimated Value
Home Financials for this Owner
Home Financials are based on the most recent Mortgage that was taken out on this home.
Original Mortgage
$174,000
Outstanding Balance
$102,212
Interest Rate
6.46%
Mortgage Type
Purchase Money Mortgage
Estimated Equity
$206,636
Purchase Details
Closed on
Aug 15, 2005
Sold by
Rose Brian Keith and Rose Jennifer Rae
Bought by
Cooper Bill R and Cooper Sherry L
Home Financials for this Owner
Home Financials are based on the most recent Mortgage that was taken out on this home.
Original Mortgage
$163,400
Interest Rate
5.61%
Mortgage Type
Fannie Mae Freddie Mac
Purchase Details
Closed on
Mar 29, 2001
Sold by
Westec Properties Oklahoma Llc
Bought by
Rose Brian Keith and Rose Jennifer Rae
Home Financials for this Owner
Home Financials are based on the most recent Mortgage that was taken out on this home.
Original Mortgage
$122,320
Interest Rate
7.13%
Create a Home Valuation Report for This Property
The Home Valuation Report is an in-depth analysis detailing your home's value as well as a comparison with similar homes in the area
Home Values in the Area
Average Home Value in this Area
Purchase History
| Date | Buyer | Sale Price | Title Company |
|---|---|---|---|
| Martin Randal M | $174,000 | None Available | |
| Cooper Bill R | $172,000 | -- | |
| Rose Brian Keith | $153,000 | -- |
Source: Public Records
Mortgage History
| Date | Status | Borrower | Loan Amount |
|---|---|---|---|
| Open | Martin Randal M | $174,000 | |
| Previous Owner | Cooper Bill R | $163,400 | |
| Previous Owner | Rose Brian Keith | $122,320 | |
| Closed | Rose Brian Keith | $30,580 |
Source: Public Records
Tax History Compared to Growth
Tax History
| Year | Tax Paid | Tax Assessment Tax Assessment Total Assessment is a certain percentage of the fair market value that is determined by local assessors to be the total taxable value of land and additions on the property. | Land | Improvement |
|---|---|---|---|---|
| 2025 | $2,731 | $19,915 | $2,111 | $17,804 |
| 2024 | $2,618 | $19,305 | $2,191 | $17,114 |
| 2023 | $2,618 | $19,714 | $2,520 | $17,194 |
| 2022 | $2,549 | $18,140 | $3,388 | $14,752 |
| 2021 | $2,382 | $18,140 | $3,388 | $14,752 |
| 2020 | $2,397 | $18,140 | $3,388 | $14,752 |
| 2019 | $2,406 | $18,140 | $3,388 | $14,752 |
| 2018 | $2,384 | $18,140 | $3,388 | $14,752 |
| 2017 | $2,369 | $19,140 | $3,575 | $15,565 |
| 2016 | $2,340 | $19,140 | $3,575 | $15,565 |
| 2015 | $2,238 | $19,140 | $3,575 | $15,565 |
| 2014 | $2,235 | $19,140 | $3,575 | $15,565 |
Source: Public Records
Map
Nearby Homes
- 13506 S 101st Ave E
- 13456 S 101st East Ave
- 13512 S 101st East Ave
- 9923 E 124th St S
- 12215 S 99th East Ave
- 12429 S 99th East Ave
- 12233 S 102nd East Ave
- 9923 E 119th Place S
- 12419 S 102nd East Ave
- 12179 S 104th East Ave
- 11976 S 96th East Place
- 11973 S 96th East Place
- 9617 E 119th St S
- 9613 E 119th Ct S
- 11965 S 94th East Ave
- 11966 S 94th East Ave
- 9907 E 118th St S
- 11962 S 94th East Ave
- 12373 S 105th East Ave
- 9632 E 118th Place S
- 10004 E 123rd St S
- 10016 E 123rd St S
- 13328 S 124th East Ave
- 12944 S 124th East Ave
- 9961 E 124th St S
- 9955 E 124th St S
- 9922 E 123rd St S
- 9949 E 124th St S
- 10009 E 123rd St S
- 12933 S 123rd Ave E
- 10022 E 123rd St S
- 10005 E 123rd St S
- 13337 S 124th East Ave
- 12743 S 124th East Ave
- 12625 S 124th East Ave
- 12811 S 124th East Ave
- 9943 E 124th St S
- 12116 S 101st East Ave
- 9916 E 123rd St S
- 12121 S 101st East Ave