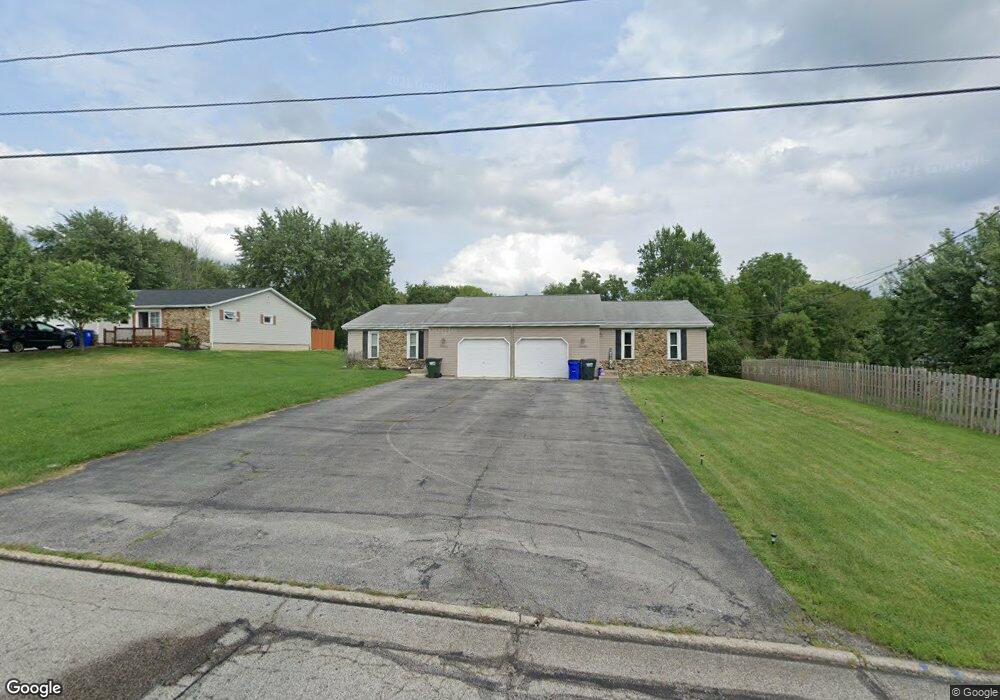
10010 Hazelton Rd Streetsboro, OH 44241
Estimated Value: $271,000 - $311,800
6
Beds
4
Baths
2,894
Sq Ft
$99/Sq Ft
Est. Value
About This Home
This home is located at 10010 Hazelton Rd, Streetsboro, OH 44241 and is currently estimated at $285,450, approximately $98 per square foot. 10010 Hazelton Rd is a home located in Portage County with nearby schools including Streetsboro High School and Crossroads Christian Academy.
Ownership History
Date
Name
Owned For
Owner Type
Purchase Details
Closed on
Mar 30, 2020
Sold by
Woolf Diana M and Woolf James
Bought by
Woolf Richard Charles
Current Estimated Value
Home Financials for this Owner
Home Financials are based on the most recent Mortgage that was taken out on this home.
Original Mortgage
$186,480
Outstanding Balance
$165,199
Interest Rate
3.4%
Mortgage Type
VA
Estimated Equity
$120,251
Purchase Details
Closed on
Aug 2, 2006
Sold by
Woolf Diana M and Woolf James
Bought by
Woolf Diana M and Woolf James
Purchase Details
Closed on
May 31, 2006
Sold by
Woolf Diana M and Griffin Eugene
Bought by
Woolf Diana M
Purchase Details
Closed on
Jun 30, 1997
Sold by
Samol Steve J
Bought by
Griffin Diana M Leroux and Griffin Eugene
Home Financials for this Owner
Home Financials are based on the most recent Mortgage that was taken out on this home.
Original Mortgage
$127,096
Interest Rate
8%
Mortgage Type
FHA
Create a Home Valuation Report for This Property
The Home Valuation Report is an in-depth analysis detailing your home's value as well as a comparison with similar homes in the area
Home Values in the Area
Average Home Value in this Area
Purchase History
| Date | Buyer | Sale Price | Title Company |
|---|---|---|---|
| Woolf Richard Charles | $180,000 | None Available | |
| Woolf Diana M | -- | None Available | |
| Woolf Diana M | -- | Title Xperts Agency Inc | |
| Griffin Diana M Leroux | $128,000 | -- |
Source: Public Records
Mortgage History
| Date | Status | Borrower | Loan Amount |
|---|---|---|---|
| Open | Woolf Richard Charles | $186,480 | |
| Previous Owner | Griffin Diana M Leroux | $127,096 |
Source: Public Records
Tax History Compared to Growth
Tax History
| Year | Tax Paid | Tax Assessment Tax Assessment Total Assessment is a certain percentage of the fair market value that is determined by local assessors to be the total taxable value of land and additions on the property. | Land | Improvement |
|---|---|---|---|---|
| 2024 | $3,896 | $93,490 | $14,770 | $78,720 |
| 2023 | $3,705 | $72,800 | $14,770 | $58,030 |
| 2022 | $3,710 | $72,800 | $14,770 | $58,030 |
| 2021 | $3,724 | $72,800 | $14,770 | $58,030 |
| 2020 | $3,611 | $64,790 | $14,770 | $50,020 |
| 2019 | $3,645 | $64,790 | $14,770 | $50,020 |
| 2018 | $2,791 | $55,720 | $13,020 | $42,700 |
| 2017 | $2,791 | $55,720 | $13,020 | $42,700 |
| 2016 | $2,793 | $55,720 | $13,020 | $42,700 |
| 2015 | $2,857 | $55,720 | $13,020 | $42,700 |
| 2014 | $2,822 | $55,720 | $13,020 | $42,700 |
| 2013 | $2,810 | $55,720 | $13,020 | $42,700 |
Source: Public Records
Map
Nearby Homes
- 932 Bristol Ln Unit O47
- 955 Bristol Ln
- 10100 N Delmonte Blvd
- 10150 Gloucester Rd
- 1041 Fronek Dr
- 805 Hunter Ridge Dr
- 9802 S Delmonte Blvd
- 749 Antler Trail
- 1290 Edgewood Ln
- 10131 Buckhorn Trail
- 9868 Meldon Dr
- 9989 Beverly Ln Unit 5E
- 1341 Adele Dr Unit 13A
- 10045 Brushwood Dr
- 1426 Lancelot St
- 1471 Lancelot St
- 572 David Dr
- 1289 Apache Pass
- 1223 Cherokee Trail
- 1556 Clarius Cir E
- 10020 Hazelton Rd Unit A
- 10022 Hazelton Rd
- 1025 Montclair Dr
- 1035 Montclair Dr
- 10032 Hazelton Rd
- 10030 Hazelton Rd
- 10032 Hazelton Rd Unit A
- 10011 N Delmonte Blvd
- 1007 Montclair Dr
- 10019 Hazelton Rd
- 10021 Hazelton Rd Unit A
- 10011 Hazelton Rd
- 10042 Hazelton Rd
- 10040 Hazelton Rd
- 10042 Hazelton Rd Unit B
- 10031 N Delmonte Blvd
- 10001 N Delmonte Blvd
- 10021 N Delmonte Blvd
- 10029 Hazelton Rd
- 995 Montclair Dr