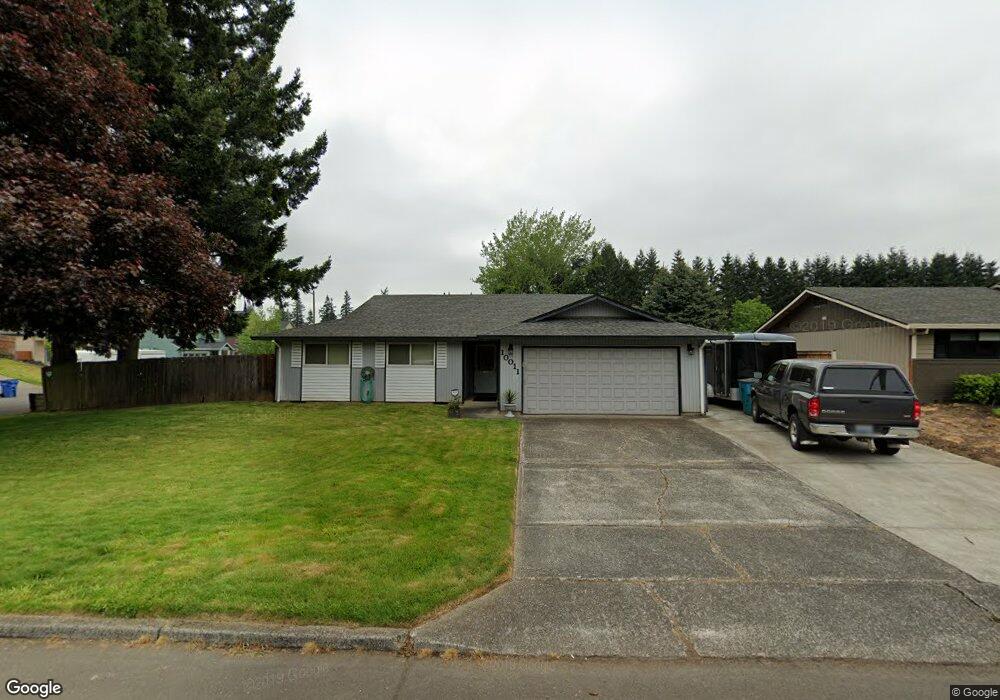
10011 NE 43rd Ave Vancouver, WA 98686
Estimated Value: $483,000 - $538,000
3
Beds
2
Baths
1,600
Sq Ft
$316/Sq Ft
Est. Value
About This Home
This home is located at 10011 NE 43rd Ave, Vancouver, WA 98686 and is currently estimated at $505,468, approximately $315 per square foot. 10011 NE 43rd Ave is a home located in Clark County with nearby schools including Pleasant Valley Primary School, Pleasant Valley Middle School, and Prairie High School.
Ownership History
Date
Name
Owned For
Owner Type
Purchase Details
Closed on
Jun 17, 2003
Sold by
Crabb Robert E and Marlene Crabb D
Bought by
Cross Richard C and Christianson Melissa M
Current Estimated Value
Home Financials for this Owner
Home Financials are based on the most recent Mortgage that was taken out on this home.
Original Mortgage
$156,300
Outstanding Balance
$67,224
Interest Rate
5.53%
Mortgage Type
Purchase Money Mortgage
Estimated Equity
$438,244
Purchase Details
Closed on
Dec 10, 2002
Sold by
Ludwig Charles L and Ludwig Carol
Bought by
Crabb Robert E and Marlene Crabb D
Home Financials for this Owner
Home Financials are based on the most recent Mortgage that was taken out on this home.
Original Mortgage
$106,400
Interest Rate
6.06%
Purchase Details
Closed on
Apr 25, 2002
Sold by
Welker Noel D
Bought by
Ludwig Charles L and Ludwig Carol
Create a Home Valuation Report for This Property
The Home Valuation Report is an in-depth analysis detailing your home's value as well as a comparison with similar homes in the area
Home Values in the Area
Average Home Value in this Area
Purchase History
| Date | Buyer | Sale Price | Title Company |
|---|---|---|---|
| Cross Richard C | $156,300 | First American Title | |
| Crabb Robert E | $106,382 | First American Title | |
| Ludwig Charles L | -- | First American Title Ins Co |
Source: Public Records
Mortgage History
| Date | Status | Borrower | Loan Amount |
|---|---|---|---|
| Open | Cross Richard C | $156,300 | |
| Previous Owner | Crabb Robert E | $106,400 |
Source: Public Records
Tax History Compared to Growth
Tax History
| Year | Tax Paid | Tax Assessment Tax Assessment Total Assessment is a certain percentage of the fair market value that is determined by local assessors to be the total taxable value of land and additions on the property. | Land | Improvement |
|---|---|---|---|---|
| 2025 | $3,856 | $491,558 | $216,000 | $275,558 |
| 2024 | $3,440 | $448,840 | $216,000 | $232,840 |
| 2023 | $3,577 | $443,689 | $216,000 | $227,689 |
| 2022 | $3,079 | $426,508 | $209,250 | $217,258 |
| 2021 | $3,063 | $332,572 | $119,000 | $213,572 |
| 2020 | $3,047 | $299,844 | $108,500 | $191,344 |
| 2019 | $2,555 | $290,639 | $113,400 | $177,239 |
| 2018 | $3,016 | $276,367 | $0 | $0 |
| 2017 | $2,566 | $247,796 | $0 | $0 |
| 2016 | $2,580 | $225,275 | $0 | $0 |
| 2015 | $2,414 | $208,496 | $0 | $0 |
| 2014 | -- | $183,908 | $0 | $0 |
| 2013 | -- | $167,601 | $0 | $0 |
Source: Public Records
Map
Nearby Homes
- 1399 Plan at Lalonde West
- 1139 Plan at Lalonde West
- 1080 Plan at Lalonde West
- 4404 NE 101st St
- 4406 NE 101st St
- 4408 NE 101st St
- 9718 NE 45th Place
- 4208 NE 105th St
- 18410 NE 43rd Place Unit LOT 205
- 18412 NE 43rd Place Unit LOT 204
- 18408 NE 43rd Place Unit LOT 206
- 18414 NE 43rd Place Unit LOT 203
- 18404 NE 43rd Place Unit LOT 208
- 18406 NE 43rd Place Unit LOT 207
- 3615 NE 102nd St
- 3604 NE 170th St
- 4514 NE 94th St
- 4528 NE 93rd St
- 4111 NE 109th Cir
- 3801 NE 93rd St
- 10005 NE 43rd Ave
- 4307 NE 101st St
- 4304 NE 101st St
- 10010 NE 43rd Ave
- 9919 NE 43rd Ave
- 4311 NE 101st St
- 4308 NE 101st St
- 10004 NE 43rd Ave
- 4119 NE Bonnie Dr
- 4310 NE 101st St
- 10003 NE 44th Ct
- 10004 NE 44th Ct
- 9912 NE 44th Ct
- 10109 NE 43rd Ave
- 4312 NE 101st St
- 9918 NE 43rd Ave
- 4114 NE 100th Cir
- 10002 NE 44th Ct
- 9911 NE 43rd Ave
- 10114 NE 44th Ct