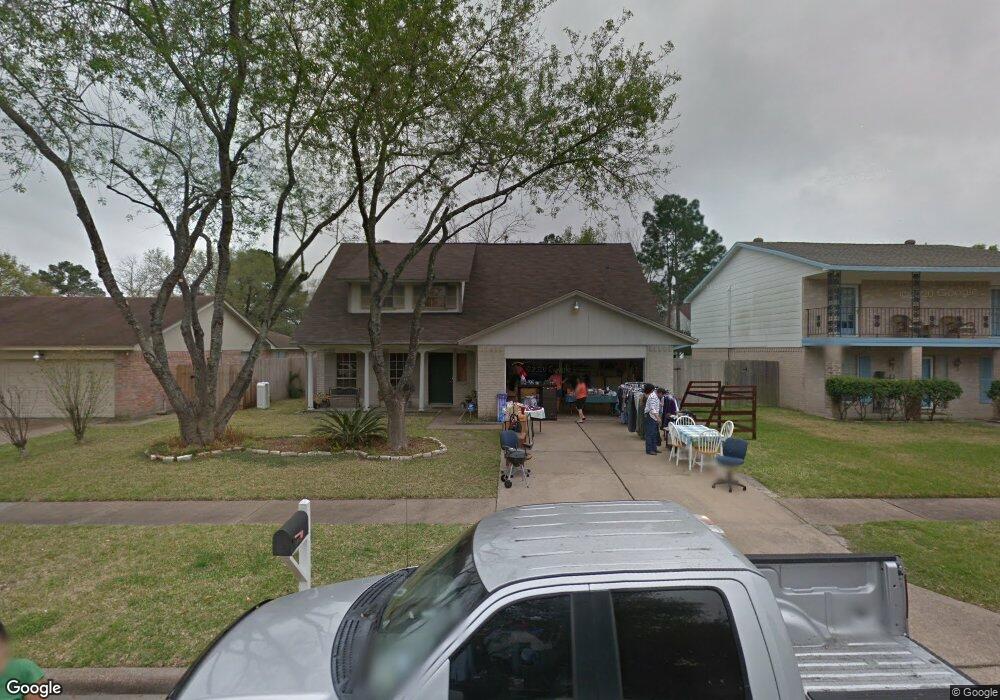
10011 Rippling Fields Dr Houston, TX 77064
Estimated Value: $244,412 - $284,000
5
Beds
2
Baths
2,032
Sq Ft
$130/Sq Ft
Est. Value
About This Home
This home is located at 10011 Rippling Fields Dr, Houston, TX 77064 and is currently estimated at $263,353, approximately $129 per square foot. 10011 Rippling Fields Dr is a home located in Harris County with nearby schools including Francone Elementary School, Campbell Middle School, and Cypress Ridge High School.
Ownership History
Date
Name
Owned For
Owner Type
Purchase Details
Closed on
Sep 28, 2004
Sold by
Entrust Retirement Services Inc
Bought by
Compean Esau
Current Estimated Value
Home Financials for this Owner
Home Financials are based on the most recent Mortgage that was taken out on this home.
Original Mortgage
$115,500
Outstanding Balance
$57,355
Interest Rate
5.81%
Mortgage Type
Purchase Money Mortgage
Estimated Equity
$205,998
Purchase Details
Closed on
Aug 5, 2003
Sold by
Revalce Thomas M and Revalce Ireta M
Bought by
Entrust Retirement Services Inc and Ira #10040-02
Purchase Details
Closed on
Jan 11, 1995
Sold by
Trivedi Bal C and Trivedi Urmila B
Bought by
Revalee Thomas M and Revalee Ireta M
Home Financials for this Owner
Home Financials are based on the most recent Mortgage that was taken out on this home.
Original Mortgage
$70,961
Interest Rate
9.19%
Mortgage Type
FHA
Create a Home Valuation Report for This Property
The Home Valuation Report is an in-depth analysis detailing your home's value as well as a comparison with similar homes in the area
Home Values in the Area
Average Home Value in this Area
Purchase History
| Date | Buyer | Sale Price | Title Company |
|---|---|---|---|
| Compean Esau | -- | American Title Co | |
| Entrust Retirement Services Inc | -- | Fidelity National Title | |
| Revalee Thomas M | -- | Stewart Title |
Source: Public Records
Mortgage History
| Date | Status | Borrower | Loan Amount |
|---|---|---|---|
| Open | Compean Esau | $115,500 | |
| Previous Owner | Revalee Thomas M | $70,961 |
Source: Public Records
Tax History Compared to Growth
Tax History
| Year | Tax Paid | Tax Assessment Tax Assessment Total Assessment is a certain percentage of the fair market value that is determined by local assessors to be the total taxable value of land and additions on the property. | Land | Improvement |
|---|---|---|---|---|
| 2025 | $2,940 | $231,491 | $62,167 | $169,324 |
| 2024 | $2,940 | $222,306 | $62,167 | $160,139 |
| 2023 | $2,940 | $228,744 | $62,167 | $166,577 |
| 2022 | $4,465 | $198,368 | $49,664 | $148,704 |
| 2021 | $4,282 | $167,364 | $49,664 | $117,700 |
| 2020 | $4,051 | $152,719 | $38,203 | $114,516 |
| 2019 | $3,830 | $140,016 | $23,269 | $116,747 |
| 2018 | $1,111 | $127,719 | $23,269 | $104,450 |
| 2017 | $3,496 | $127,719 | $23,269 | $104,450 |
| 2016 | $3,496 | $127,719 | $23,269 | $104,450 |
| 2015 | $3,004 | $113,800 | $23,269 | $90,531 |
| 2014 | $3,004 | $106,938 | $19,449 | $87,489 |
Source: Public Records
Map
Nearby Homes
- 10211 Golden Meadow Dr
- 10115 Crescent Moon Dr
- 10015 Crescent Moon Dr
- 10218 Golden Meadow Dr
- 10306 Golden Meadow Dr
- 11014 Broken Sky Dr
- 10006 Twilight Moon Dr
- 10411 Rippling Fields Dr
- 11110 Broken Sky Dr
- 10506 Twilight Moon Dr
- 10534 Walnut Glen Dr
- 10550 Walnut Glen Dr
- 10511 Stormy Sky Dr
- 11234 Rippling Meadows Dr
- 10067 Lazy Meadows Dr
- 10039 Briarpark Trail Ln
- 9406 Walnut Glen Dr
- 10303 N Laurel Branch Dr
- 11138 Opatrny Meadows Ln
- 10639 Autumn Meadow Ln
- 10015 Rippling Fields Dr
- 10007 Rippling Fields Dr
- 10014 Waving Fields Dr
- 10010 Waving Fields Dr
- 10019 Rippling Fields Dr
- 10003 Rippling Fields Dr
- 10102 Waving Fields Dr
- 10006 Waving Fields Dr
- 10010 Rippling Fields Dr
- 10014 Rippling Fields Dr
- 10103 Rippling Fields Dr
- 9919 Rippling Fields Dr
- 10006 Rippling Fields Dr
- 10018 Rippling Fields Dr
- 10106 Waving Fields Dr
- 10002 Waving Fields Dr
- 10002 Rippling Fields Dr
- 9915 Rippling Fields Dr
- 10107 Rippling Fields Dr
- 10110 Waving Fields Dr