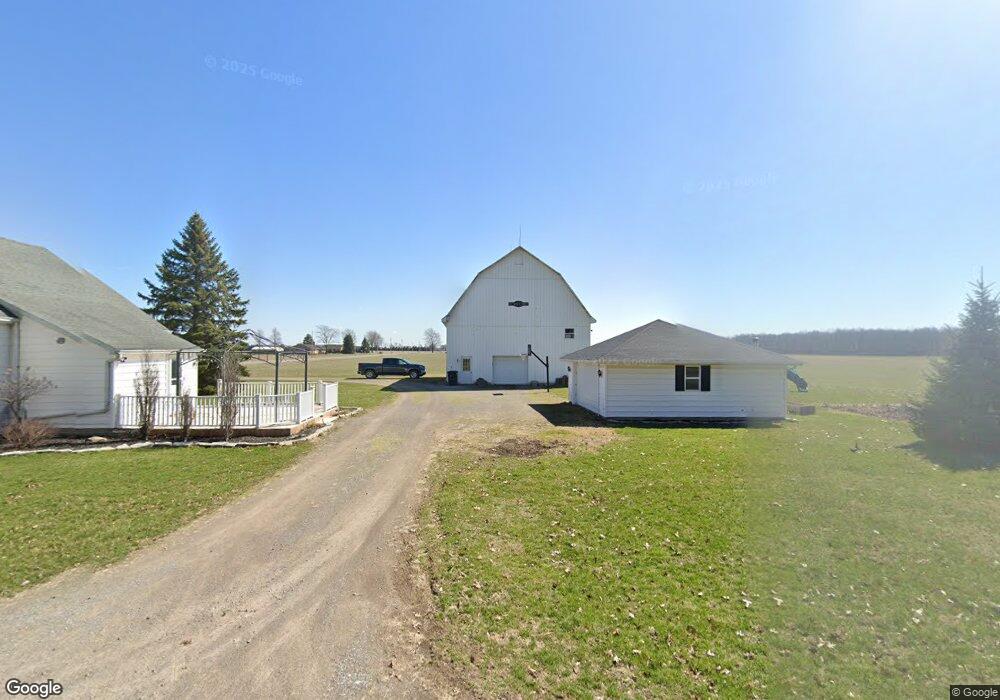
10011 Road 13i Ottawa, OH 45875
Estimated Value: $180,000 - $206,000
--
Bed
1
Bath
896
Sq Ft
$215/Sq Ft
Est. Value
About This Home
This home is located at 10011 Road 13i, Ottawa, OH 45875 and is currently estimated at $192,667, approximately $215 per square foot. 10011 Road 13i is a home located in Putnam County with nearby schools including Ottawa-Glandorf High School.
Ownership History
Date
Name
Owned For
Owner Type
Purchase Details
Closed on
Oct 17, 2025
Sold by
Kaufman Katelyn M and Recker Luke W
Bought by
Hermiller Jacob K and Beining Taylor J
Current Estimated Value
Purchase Details
Closed on
Jan 18, 2019
Sold by
Wilson Nicholas E and Wilson Katie L
Bought by
Kaufman Katelyn M and Recker Luke W
Purchase Details
Closed on
Oct 14, 2012
Sold by
Koenig Troy M and Rump Emily J
Bought by
Wilson Nicholas E and Wilson Katie L
Home Financials for this Owner
Home Financials are based on the most recent Mortgage that was taken out on this home.
Original Mortgage
$112,891
Interest Rate
3.25%
Mortgage Type
FHA
Purchase Details
Closed on
Sep 18, 2009
Sold by
Ellerbrock Ryan T and Morman Michelle
Bought by
Koenig Troy M and Rump Emily J
Home Financials for this Owner
Home Financials are based on the most recent Mortgage that was taken out on this home.
Original Mortgage
$98,800
Interest Rate
5.19%
Mortgage Type
New Conventional
Create a Home Valuation Report for This Property
The Home Valuation Report is an in-depth analysis detailing your home's value as well as a comparison with similar homes in the area
Home Values in the Area
Average Home Value in this Area
Purchase History
| Date | Buyer | Sale Price | Title Company |
|---|---|---|---|
| Hermiller Jacob K | $200,000 | None Listed On Document | |
| Kaufman Katelyn M | $131,000 | None Available | |
| Wilson Nicholas E | $115,000 | Attorney | |
| Koenig Troy M | $104,000 | None Available |
Source: Public Records
Mortgage History
| Date | Status | Borrower | Loan Amount |
|---|---|---|---|
| Previous Owner | Wilson Nicholas E | $112,891 | |
| Previous Owner | Koenig Troy M | $98,800 |
Source: Public Records
Tax History Compared to Growth
Tax History
| Year | Tax Paid | Tax Assessment Tax Assessment Total Assessment is a certain percentage of the fair market value that is determined by local assessors to be the total taxable value of land and additions on the property. | Land | Improvement |
|---|---|---|---|---|
| 2024 | $1,357 | $41,640 | $6,150 | $35,490 |
| 2023 | $1,398 | $32,250 | $4,790 | $27,460 |
| 2022 | $1,245 | $32,253 | $4,792 | $27,461 |
| 2021 | $1,250 | $32,250 | $4,790 | $27,460 |
| 2020 | $1,256 | $28,100 | $4,160 | $23,940 |
| 2019 | $1,114 | $28,420 | $4,790 | $23,630 |
| 2018 | $1,092 | $28,420 | $4,790 | $23,630 |
| 2017 | $1,103 | $28,420 | $4,790 | $23,630 |
| 2016 | $1,061 | $28,100 | $4,160 | $23,940 |
| 2015 | $1,061 | $28,100 | $4,160 | $23,940 |
| 2014 | $1,030 | $28,100 | $4,160 | $23,940 |
| 2013 | $1,040 | $28,100 | $4,160 | $23,940 |
Source: Public Records
Map
Nearby Homes
- 12806 Road K
- 10025 Road 17-J
- 0 Sr 115 & Rd J Unit 6128830
- 0 Sr 115 & Rd J
- 717 & 717 1/2 & 721 E Third St
- 304 Oakview (Unit E) Dr
- 715 N Perry St
- 530 N Taft Ave
- 13100 Ohio 613
- 445 S Oak St
- 443 E 4th St
- 726 S Oak St
- #7 Oakview Dr
- #10 Oakview Dr
- #1 Oakview Dr
- #8 Oakview Dr
- #11 Oakview Dr
- #4 Oakview Dr
- #6 Oakview Dr
- #2 Oakview Dr