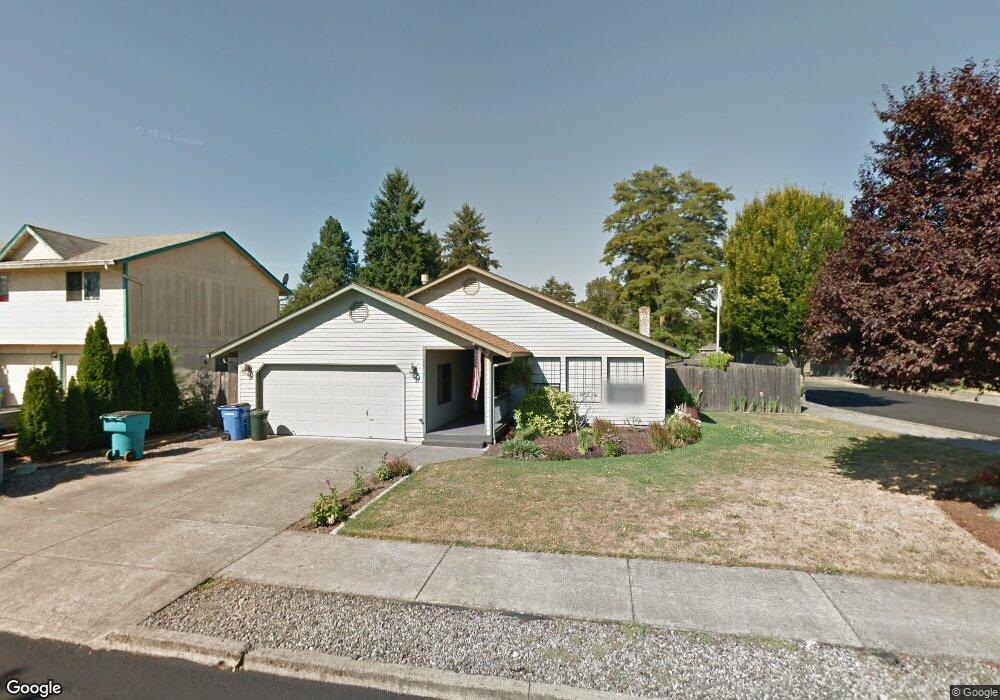
10012 NE 53rd Ave Vancouver, WA 98686
Estimated Value: $520,829 - $545,000
3
Beds
2
Baths
1,754
Sq Ft
$303/Sq Ft
Est. Value
About This Home
This home is located at 10012 NE 53rd Ave, Vancouver, WA 98686 and is currently estimated at $531,207, approximately $302 per square foot. 10012 NE 53rd Ave is a home located in Clark County with nearby schools including Pleasant Valley Primary School, Pleasant Valley Middle School, and Prairie High School.
Ownership History
Date
Name
Owned For
Owner Type
Purchase Details
Closed on
Sep 29, 2005
Sold by
Nitschke Jeffrey M and Nitschke Lisa
Bought by
Hays Michaelene M
Current Estimated Value
Home Financials for this Owner
Home Financials are based on the most recent Mortgage that was taken out on this home.
Original Mortgage
$51,750
Outstanding Balance
$27,472
Interest Rate
5.63%
Mortgage Type
Credit Line Revolving
Estimated Equity
$503,735
Purchase Details
Closed on
Jul 2, 2002
Sold by
Nitschke Lisa
Bought by
Nitschke Jeffrey M
Home Financials for this Owner
Home Financials are based on the most recent Mortgage that was taken out on this home.
Original Mortgage
$128,400
Interest Rate
6.71%
Create a Home Valuation Report for This Property
The Home Valuation Report is an in-depth analysis detailing your home's value as well as a comparison with similar homes in the area
Home Values in the Area
Average Home Value in this Area
Purchase History
| Date | Buyer | Sale Price | Title Company |
|---|---|---|---|
| Hays Michaelene M | $265,280 | First American Title | |
| Nitschke Jeffrey M | -- | Chicago Title Insurance | |
| Nitschke Jeffrey M | $160,500 | Chicago Title Insurance |
Source: Public Records
Mortgage History
| Date | Status | Borrower | Loan Amount |
|---|---|---|---|
| Open | Hays Michaelene M | $51,750 | |
| Open | Hays Michaelene M | $200,000 | |
| Previous Owner | Nitschke Jeffrey M | $128,400 | |
| Closed | Nitschke Jeffrey M | $9,000 |
Source: Public Records
Tax History Compared to Growth
Tax History
| Year | Tax Paid | Tax Assessment Tax Assessment Total Assessment is a certain percentage of the fair market value that is determined by local assessors to be the total taxable value of land and additions on the property. | Land | Improvement |
|---|---|---|---|---|
| 2025 | $3,918 | $504,724 | $192,000 | $312,724 |
| 2024 | $3,468 | $456,246 | $192,000 | $264,246 |
| 2023 | $3,741 | $488,876 | $192,000 | $296,876 |
| 2022 | $3,277 | $446,401 | $192,000 | $254,401 |
| 2021 | $3,331 | $354,262 | $119,000 | $235,262 |
| 2020 | $3,279 | $326,613 | $109,480 | $217,133 |
| 2019 | $2,831 | $313,116 | $109,480 | $203,636 |
| 2018 | $3,329 | $306,898 | $0 | $0 |
| 2017 | $2,850 | $274,547 | $0 | $0 |
| 2016 | $2,857 | $250,869 | $0 | $0 |
| 2015 | $2,887 | $231,489 | $0 | $0 |
| 2014 | -- | $221,042 | $0 | $0 |
| 2013 | -- | $186,512 | $0 | $0 |
Source: Public Records
Map
Nearby Homes
- 5602 NE 102nd St
- 9417 NE 52nd Ave
- 11005 NE 55th Ave
- 11013 NE 55th Ave
- 11001 NE 55th Ave
- 9700 NE 59th Ave
- 10005 NE Banton Dr
- 6107 NE Erin Way
- 4408 NE 101st St
- 4406 NE 101st St
- 4404 NE 101st St
- 9718 NE 45th Place
- 1399 Plan at Lalonde West
- 1139 Plan at Lalonde West
- 1080 Plan at Lalonde West
- 4911 NE 109th St
- 4514 NE 94th St
- 6307 NE Wilding Rd
- 4528 NE 93rd St
- 10909 NE 64th Ct Unit Lot 3
- 10008 NE 53rd Ave
- 9918 NE 53rd Ave
- 5211 NE 101st St
- 5305 NE 101st St
- 5214 NE 101st St
- 5218 NE 101st St
- 9914 NE 53rd Ave
- 5307 NE 101st St
- 5304 NE 101st St
- 9919 NE 53rd Ave
- 5203 NE 101st St
- 5303 NE 101st Cir
- 5306 NE 101st St
- 9908 NE 53rd Ave
- 9915 NE 53rd Ave
- 5311 NE 101st St
- 5308 NE 100th Cir
- 5305 NE 101st Cir
- 5200 NE 101st St
- 5212 NE 99th St