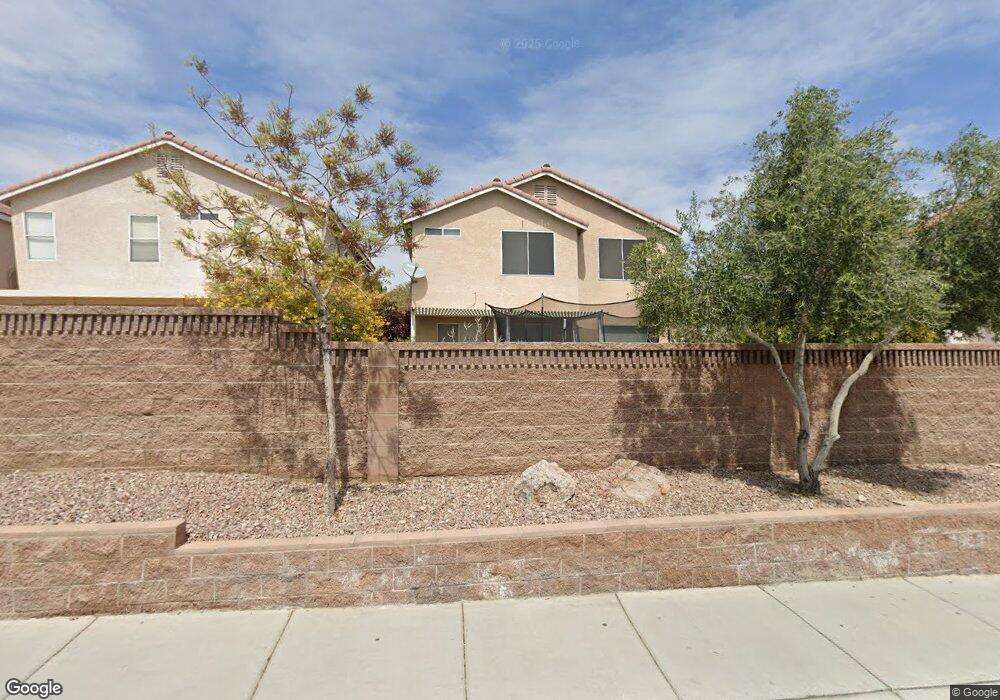
10013 Capistrello Ave Las Vegas, NV 89147
Estimated Value: $425,400 - $448,000
3
Beds
3
Baths
1,544
Sq Ft
$282/Sq Ft
Est. Value
About This Home
This home is located at 10013 Capistrello Ave, Las Vegas, NV 89147 and is currently estimated at $436,100, approximately $282 per square foot. 10013 Capistrello Ave is a home located in Clark County with nearby schools including Sandra B Abston Elementary School, Victoria Fertitta Middle School, and Durango High School.
Ownership History
Date
Name
Owned For
Owner Type
Purchase Details
Closed on
Jul 9, 2014
Sold by
Bian Shu Fang
Bought by
Sicat Christopher A
Current Estimated Value
Home Financials for this Owner
Home Financials are based on the most recent Mortgage that was taken out on this home.
Original Mortgage
$187,540
Outstanding Balance
$143,330
Interest Rate
4.25%
Mortgage Type
FHA
Estimated Equity
$292,770
Purchase Details
Closed on
Nov 19, 2003
Sold by
Wang Yong and Bian Shu Fang
Bought by
Bian Shu Fang
Home Financials for this Owner
Home Financials are based on the most recent Mortgage that was taken out on this home.
Original Mortgage
$110,000
Interest Rate
5.89%
Mortgage Type
Unknown
Purchase Details
Closed on
May 23, 2001
Sold by
Wang Yong and Bian Shu Fang
Bought by
Bian Shu Fang
Home Financials for this Owner
Home Financials are based on the most recent Mortgage that was taken out on this home.
Original Mortgage
$114,760
Interest Rate
7.06%
Create a Home Valuation Report for This Property
The Home Valuation Report is an in-depth analysis detailing your home's value as well as a comparison with similar homes in the area
Home Values in the Area
Average Home Value in this Area
Purchase History
| Date | Buyer | Sale Price | Title Company |
|---|---|---|---|
| Sicat Christopher A | $191,000 | Lawyers Title Of Nevada Hen | |
| Bian Shu Fang | -- | Land Title Of Nevada | |
| Bian Shu Fang | -- | Land Title | |
| Bian Shu Fang | $143,811 | Land Title |
Source: Public Records
Mortgage History
| Date | Status | Borrower | Loan Amount |
|---|---|---|---|
| Open | Sicat Christopher A | $187,540 | |
| Previous Owner | Bian Shu Fang | $110,000 | |
| Previous Owner | Bian Shu Fang | $114,760 |
Source: Public Records
Tax History Compared to Growth
Tax History
| Year | Tax Paid | Tax Assessment Tax Assessment Total Assessment is a certain percentage of the fair market value that is determined by local assessors to be the total taxable value of land and additions on the property. | Land | Improvement |
|---|---|---|---|---|
| 2025 | $2,234 | $100,472 | $39,900 | $60,572 |
| 2024 | $2,069 | $100,472 | $39,900 | $60,572 |
| 2023 | $2,069 | $92,287 | $35,000 | $57,287 |
| 2022 | $1,916 | $82,118 | $29,750 | $52,368 |
| 2021 | $1,774 | $76,787 | $26,950 | $49,837 |
| 2020 | $1,645 | $75,335 | $25,900 | $49,435 |
| 2019 | $1,541 | $70,307 | $21,700 | $48,607 |
| 2018 | $1,471 | $65,526 | $18,900 | $46,626 |
| 2017 | $1,898 | $64,732 | $17,500 | $47,232 |
| 2016 | $1,378 | $60,132 | $12,950 | $47,182 |
| 2015 | $1,374 | $48,064 | $10,850 | $37,214 |
| 2014 | $1,331 | $44,041 | $8,750 | $35,291 |
Source: Public Records
Map
Nearby Homes
- 4645 Altina St
- 10001 Peace Way Unit 2309
- 10001 Peace Way Unit 2276
- 10001 Peace Way Unit 2322
- 10001 Peace Way Unit 2181
- 10001 Peace Way Unit 1296
- 4786 Castel Martini Ct
- 10188 Campo Tizzoro
- 9844 Ashton Pines Ct
- 4672 Regalo Bello St
- 9975 Peace Way Unit 2174
- 9975 Peace Way Unit 1149
- 4615 Regalo Bello St
- 4814 Regalo Bello St Unit 4
- 9794 Villa Lorena Ave
- 4508 Regalo Bello St Unit 6
- 4750 Fiore Bella Blvd
- 10034 White Mulberry Dr
- 10255 Riva de Angelo Ave
- 9748 Villa Lorena Ave
- 10019 Capistrello Ave Unit 1
- 10007 Capistrello Ave
- 10025 Capistrello Ave
- 10031 Capistrello Ave
- 10012 Capistrello Ave
- 10018 Capistrello Ave
- 10006 Capistrello Ave
- 10024 Capistrello Ave Unit 1
- 4704 Skyhawk Canyon St Unit 4
- 10037 Capistrello Ave
- 4712 Skyhawk Canyon St
- 4667 Nocera St
- 10043 Capistrello Ave
- 10036 Stampede Canyon Ct
- 9980 Ridge Hill Ave
- 4659 Nocera St Unit 1
- 10049 Capistrello Ave
- 4720 Skyhawk Canyon St
- 10013 Carsoli Ct
- 10013 Carsoli Ct Unit na