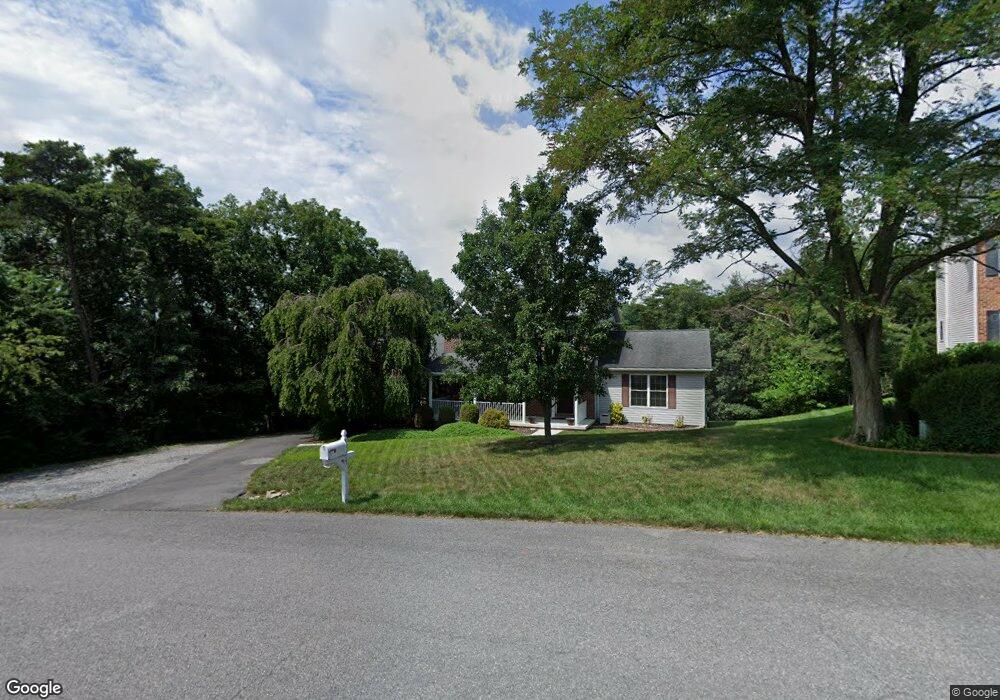
10015 Carrington Ct Cumberland, MD 21502
Estimated Value: $407,280 - $440,000
4
Beds
3
Baths
2,392
Sq Ft
$175/Sq Ft
Est. Value
About This Home
This home is located at 10015 Carrington Ct, Cumberland, MD 21502 and is currently estimated at $418,070, approximately $174 per square foot. 10015 Carrington Ct is a home located in Allegany County with nearby schools including West Side Elementary School, Washington Middle School, and Fort Hill High School.
Ownership History
Date
Name
Owned For
Owner Type
Purchase Details
Closed on
Sep 23, 2011
Sold by
Patterson William A and Patterson Angela R
Bought by
Norton Michael W and Norton Suzanne J
Current Estimated Value
Purchase Details
Closed on
Sep 14, 2011
Sold by
Patterson William Adam and Patterson Angela Rae
Bought by
Norton Michael W and Norton Suzanne J
Purchase Details
Closed on
Nov 23, 2005
Sold by
Wells Fargo Bank Na
Bought by
Peterson Ii William A
Purchase Details
Closed on
Oct 14, 2005
Sold by
Wells Fargo Bank Na
Bought by
Peterson Ii William A
Purchase Details
Closed on
Aug 19, 2004
Sold by
Foxcraft Builders Inc
Bought by
Yussuf Tajudeen
Purchase Details
Closed on
Oct 29, 2003
Sold by
Onanuga David O
Bought by
Foxcraft Builders Inc
Purchase Details
Closed on
Aug 8, 2003
Sold by
Onass Inc & Olabisi David O
Bought by
Onanuga David O
Create a Home Valuation Report for This Property
The Home Valuation Report is an in-depth analysis detailing your home's value as well as a comparison with similar homes in the area
Home Values in the Area
Average Home Value in this Area
Purchase History
| Date | Buyer | Sale Price | Title Company |
|---|---|---|---|
| Norton Michael W | $280,000 | -- | |
| Norton Michael W | $280,000 | -- | |
| Norton Michael W | $280,000 | None Available | |
| Norton Michael W | $280,000 | -- | |
| Norton Michael W | $280,000 | -- | |
| Peterson Ii William A | $255,400 | -- | |
| Wells Fargo Bank Na | $99,000 | -- | |
| Peterson Ii William A | $255,400 | -- | |
| Wells Fargo Bank Na | $99,000 | -- | |
| Yussuf Tajudeen | $276,000 | -- | |
| Foxcraft Builders Inc | -- | -- | |
| Onanuga David O | -- | -- |
Source: Public Records
Mortgage History
| Date | Status | Borrower | Loan Amount |
|---|---|---|---|
| Closed | Peterson Ii William A | -- |
Source: Public Records
Tax History Compared to Growth
Tax History
| Year | Tax Paid | Tax Assessment Tax Assessment Total Assessment is a certain percentage of the fair market value that is determined by local assessors to be the total taxable value of land and additions on the property. | Land | Improvement |
|---|---|---|---|---|
| 2025 | $3,477 | $317,100 | $0 | $0 |
| 2024 | $3,330 | $292,800 | $0 | $0 |
| 2023 | $2,919 | $268,500 | $51,700 | $216,800 |
| 2022 | $3,128 | $263,500 | $0 | $0 |
| 2021 | $3,041 | $258,500 | $0 | $0 |
| 2020 | $3,009 | $253,500 | $61,700 | $191,800 |
| 2019 | $2,919 | $245,933 | $0 | $0 |
| 2018 | $2,829 | $238,367 | $0 | $0 |
| 2017 | $2,742 | $230,800 | $0 | $0 |
| 2016 | $0 | $230,800 | $0 | $0 |
| 2015 | $3,124 | $230,800 | $0 | $0 |
| 2014 | $3,124 | $262,300 | $0 | $0 |
Source: Public Records
Map
Nearby Homes
- 0 Amber Dr SE
- 10109 Golf Creek Dr NE
- 12101 Windsor Hills Prairie Rd
- 0 Shades Rr Unit MDAL2012350
- 210 E Reynolds St
- 311 E Reynolds St
- 518 Baltimore Ave
- 533 Fort Ave
- 534 Eastern Ave
- 501 Warren St
- 607 Leiper St
- 468 Baltimore Ave
- 9 W View Terrace
- 512 Schlund Ave
- 432 Pine Ave
- 519 Forester Ave
- 331 Francis Ct
- 531 Lowell Ave
- 714 Lincoln St
- 615 Frederick St
- 10017 Carrington Ct
- 10019 Carrington Ct
- 10018 Carrington Ct
- 10016 Carrington Ct
- 10009 Carrington Ct
- 10014 Carrington Ct
- 10012 Carrington Ct
- 10100 Hillcrest Dr
- 10010 Carrington Ct
- 12102 Scenic Dr NE
- 10005 Carrington Ct
- 10008 Carrington Ct
- 10101 Hillcrest Dr
- 10102 Hillcrest Dr
- 10019 Country Club Rd SE
- 10021 Country Club Rd SE
- 12101 Scenic Dr NE
- 10003 Carrington Ct
- 10011 Country Club Rd SE
- 10006 Carrington Ct