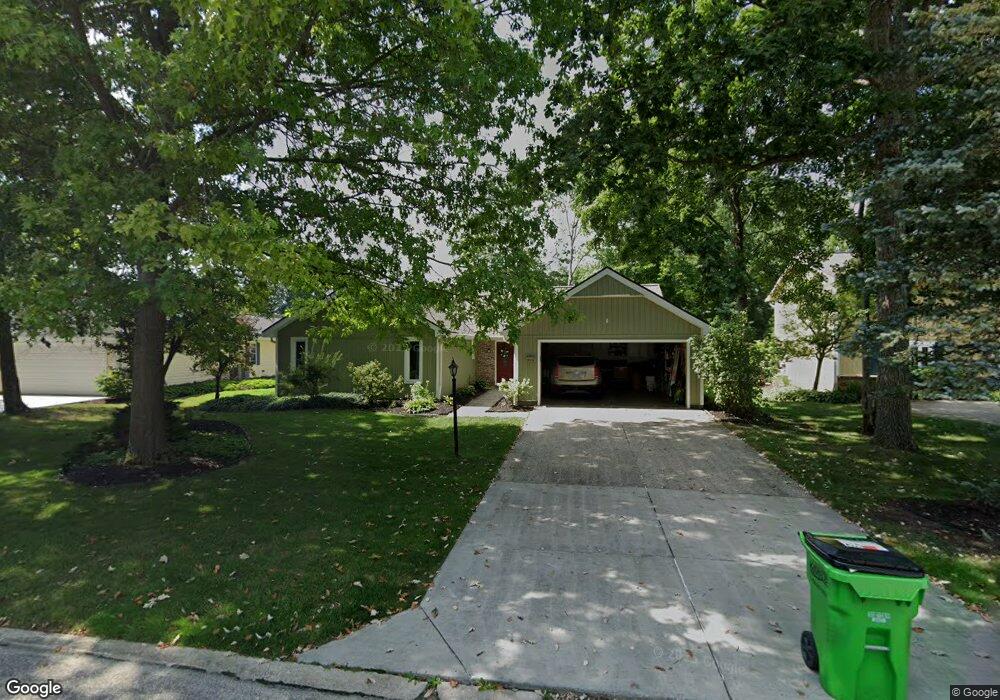
10016 Crows Nest Cove Aurora, OH 44202
Estimated Value: $455,000 - $501,000
3
Beds
2
Baths
2,516
Sq Ft
$188/Sq Ft
Est. Value
About This Home
This home is located at 10016 Crows Nest Cove, Aurora, OH 44202 and is currently estimated at $474,183, approximately $188 per square foot. 10016 Crows Nest Cove is a home located in Summit County with nearby schools including Wilcox Primary School, Samuel Bissell Elementary School, and Dodge Intermediate School.
Ownership History
Date
Name
Owned For
Owner Type
Purchase Details
Closed on
Jun 11, 2019
Sold by
Berthold Brett A and Berthold Julie
Bought by
Schmidt Paul Gregory and Schmidt Michele H
Current Estimated Value
Home Financials for this Owner
Home Financials are based on the most recent Mortgage that was taken out on this home.
Original Mortgage
$160,000
Outstanding Balance
$104,980
Interest Rate
4.1%
Mortgage Type
New Conventional
Estimated Equity
$369,203
Purchase Details
Closed on
Apr 24, 2019
Sold by
Estate Of Jonathan Richard Turpin
Bought by
Berthold Brett A
Home Financials for this Owner
Home Financials are based on the most recent Mortgage that was taken out on this home.
Original Mortgage
$160,000
Outstanding Balance
$104,980
Interest Rate
4.1%
Mortgage Type
New Conventional
Estimated Equity
$369,203
Purchase Details
Closed on
Jul 24, 2009
Sold by
Stepanek James A
Bought by
Turpin Jonathan R
Create a Home Valuation Report for This Property
The Home Valuation Report is an in-depth analysis detailing your home's value as well as a comparison with similar homes in the area
Home Values in the Area
Average Home Value in this Area
Purchase History
| Date | Buyer | Sale Price | Title Company |
|---|---|---|---|
| Schmidt Paul Gregory | $289,000 | None Available | |
| Berthold Brett A | -- | None Available | |
| Turpin Jonathan R | $230,000 | Ohio Real Title |
Source: Public Records
Mortgage History
| Date | Status | Borrower | Loan Amount |
|---|---|---|---|
| Open | Schmidt Paul Gregory | $160,000 |
Source: Public Records
Tax History
| Year | Tax Paid | Tax Assessment Tax Assessment Total Assessment is a certain percentage of the fair market value that is determined by local assessors to be the total taxable value of land and additions on the property. | Land | Improvement |
|---|---|---|---|---|
| 2024 | $6,524 | $129,193 | $18,694 | $110,499 |
| 2023 | $6,524 | $129,193 | $18,694 | $110,499 |
| 2022 | $6,046 | $107,661 | $15,579 | $92,082 |
| 2021 | $6,100 | $108,130 | $15,579 | $92,551 |
| 2020 | $6,174 | $108,130 | $15,580 | $92,550 |
| 2019 | $5,893 | $93,860 | $15,200 | $78,660 |
| 2018 | $5,653 | $93,860 | $15,200 | $78,660 |
| 2017 | $4,649 | $93,860 | $15,200 | $78,660 |
| 2016 | $4,622 | $81,930 | $15,200 | $66,730 |
| 2015 | $4,649 | $81,930 | $15,200 | $66,730 |
| 2014 | $4,637 | $81,930 | $15,200 | $66,730 |
| 2013 | $4,618 | $81,540 | $13,740 | $67,800 |
Source: Public Records
Map
Nearby Homes
- 3624 Nautilus Trail
- 10137 Tradewinds Cove
- 3660 Ivy Ct
- 3659 Shady Timber Dr
- 10400 Maryland St
- 3784 Firethorn Dr
- 10265 Beaver Trail
- 3645 Firethorn Dr
- 10453 Dogwood Dr
- 3564 Shady Timber Dr
- 10373 Glenway Dr Unit 202
- 10564 Herrington Dr
- 1060 Bryce Ave
- 1177 Moneta Ave
- 954 Bryce Ave
- 1000 Michigan St
- 436 Cochran Rd
- 1101 Lake Ave
- SL Moneta Ave
- 3082 Willowbrook Dr
- 10024 Crows Nest Cove
- 10008 Crows Nest Cove
- 10032 Crows Nest Cove
- 10000 Crows Nest Cove
- 10031 Regatta Trail
- 10039 Regatta Trail
- 10023 Regatta Trail
- 10047 Regatta Trail
- 10040 Crows Nest Cove
- 10015 Crows Nest Cove
- 10055 Regatta Trail
- 10021 Crows Nest Cove
- 10009 Crows Nest Cove
- 10033 Crows Nest Cove
- 9990 Crows Nest Cove
- 10001 Crows Nest Cove
- 10048 Crows Nest Cove
- 10063 Regatta Trail
- 3755 Surfside Cir
- 10041 Crows Nest Cove
Your Personal Tour Guide
Ask me questions while you tour the home.