
Seller's Agent in 2025
Shawn White
Windermere/Coeur d'Alene Realty Inc - PF
(208) 699-3928
51 Total Sales

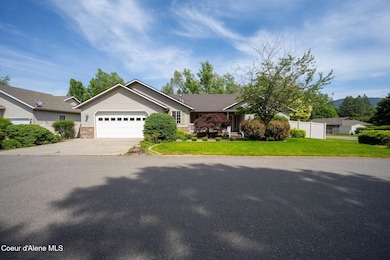
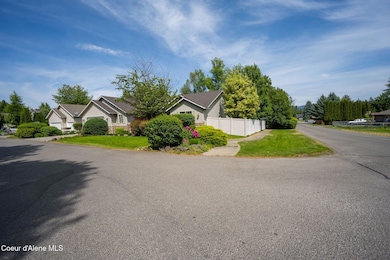
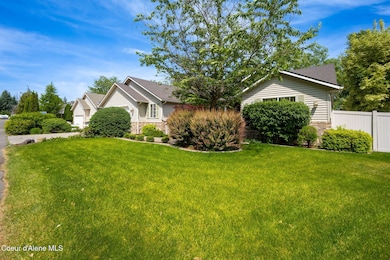
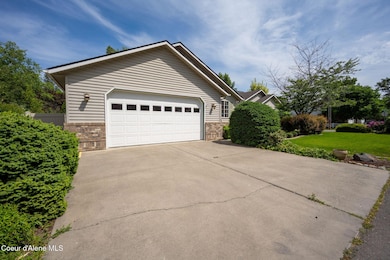
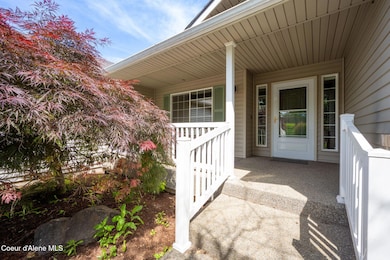

Beautiful single-story rancher near Hayden Lake Country Club. 3 bed/2.5 ba split bedroom design w/add'l room for office or den. All the bells & whistles come with this home! Full granite kitchen w/ breakfast bar, central vac, tankless water heater, A/C, RV access to backyard, shop area in garage, plus lovely views of Canfield Mtn. from covered deck!
Last Agent to Sell the Property
Windermere/Coeur d'Alene Realty Inc - PF License #SP45477 Listed on: 09/29/2025
| Date | Type | Sale Price | Title Company |
|---|---|---|---|
| Warranty Deed | -- | Title One | |
| Warranty Deed | -- | -- | |
| Warranty Deed | -- | -- | |
| Interfamily Deed Transfer | -- | -- | |
| Warranty Deed | -- | -- |
| Date | Status | Loan Amount | Loan Type |
|---|---|---|---|
| Open | $564,585 | FHA | |
| Previous Owner | $334,900 | Adjustable Rate Mortgage/ARM | |
| Previous Owner | $256,800 | New Conventional |
| Date | Event | Price | List to Sale | Price per Sq Ft |
|---|---|---|---|---|
| 11/07/2025 11/07/25 | Sold | -- | -- | -- |
| 10/18/2025 10/18/25 | Pending | -- | -- | -- |
| 10/01/2025 10/01/25 | For Sale | $585,000 | 0.0% | $291 / Sq Ft |
| 09/30/2025 09/30/25 | Off Market | -- | -- | -- |
| 09/29/2025 09/29/25 | For Sale | $585,000 | -- | $291 / Sq Ft |
| Year | Tax Paid | Tax Assessment Tax Assessment Total Assessment is a certain percentage of the fair market value that is determined by local assessors to be the total taxable value of land and additions on the property. | Land | Improvement |
|---|---|---|---|---|
| 2025 | $1,848 | $555,340 | $195,000 | $360,340 |
| 2024 | $1,757 | $540,510 | $180,000 | $360,510 |
| 2023 | $1,757 | $558,536 | $180,000 | $378,536 |
| 2022 | $2,160 | $618,192 | $200,000 | $418,192 |
| 2021 | $2,081 | $416,532 | $125,000 | $291,532 |
| 2020 | $2,089 | $357,872 | $100,000 | $257,872 |
| 2019 | $2,028 | $329,806 | $96,800 | $233,006 |
| 2018 | $1,880 | $289,740 | $88,000 | $201,740 |
| 2017 | $1,725 | $261,620 | $65,000 | $196,620 |
| 2016 | $1,641 | $241,980 | $57,500 | $184,480 |
| 2015 | $1,526 | $222,870 | $46,000 | $176,870 |
| 2013 | $1,422 | $196,480 | $36,800 | $159,680 |
Seller's Agent in 2025
Shawn White
Windermere/Coeur d'Alene Realty Inc - PF
(208) 699-3928
51 Total Sales
C
Buyer's Agent in 2025
Chad Mitchell
Keller Williams Realty Coeur d'Alene
(208) 625-7106
95 Total Sales
Source: Coeur d'Alene Multiple Listing Service
MLS Number: 25-9850
APN: H13500010010
Disclaimer: Certain information contained herein is derived from information provided by parties other than Homes.com. All information provided is deemed reliable, but is not guaranteed to be accurate and should be independently verified.
![]() IDX information is provided exclusively for personal, non-commercial use, and may not be used for any purpose other than to identify prospective properties consumers may be interested in purchasing.
IDX information is provided exclusively for personal, non-commercial use, and may not be used for any purpose other than to identify prospective properties consumers may be interested in purchasing.
Information is deemed reliable but not guaranteed.