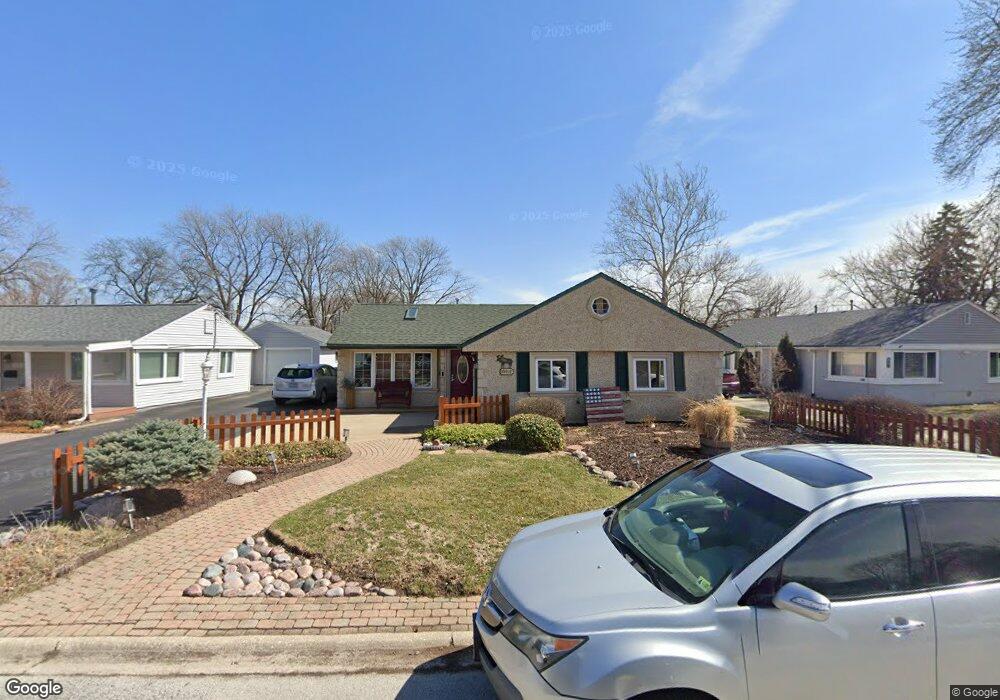
10017 Harnew Rd W Oak Lawn, IL 60453
Estimated Value: $286,000 - $314,000
3
Beds
1
Bath
1,705
Sq Ft
$174/Sq Ft
Est. Value
About This Home
This home is located at 10017 Harnew Rd W, Oak Lawn, IL 60453 and is currently estimated at $295,831, approximately $173 per square foot. 10017 Harnew Rd W is a home located in Cook County with nearby schools including Sward Elementary School, Kolmar Avenue Elementary School, and J Covington Elementary School.
Ownership History
Date
Name
Owned For
Owner Type
Purchase Details
Closed on
Dec 13, 2021
Sold by
James C Carlson C and James Kimberly L
Bought by
Carlson Kimberly L
Current Estimated Value
Purchase Details
Closed on
Jan 20, 2021
Sold by
Carlson James C and Carlson Kimberly L
Bought by
Carlson James C and Carlson Kimberly L
Purchase Details
Closed on
Dec 29, 2005
Sold by
Carlson James C and Carlson Kimberly L
Bought by
Carlson James C and Carlson Joi Joi L
Purchase Details
Closed on
Sep 14, 2001
Sold by
Fifth Third Bank
Bought by
Carlson James C and Carlson Kimberly L
Purchase Details
Closed on
Sep 25, 1997
Sold by
Carlson Barbara
Bought by
First National Bank Of Evergreen Park and Trust #15648
Create a Home Valuation Report for This Property
The Home Valuation Report is an in-depth analysis detailing your home's value as well as a comparison with similar homes in the area
Home Values in the Area
Average Home Value in this Area
Purchase History
| Date | Buyer | Sale Price | Title Company |
|---|---|---|---|
| Carlson Kimberly L | -- | None Listed On Document | |
| Carlson Kimberly L | -- | -- | |
| Carlson James C | -- | Fidelity National Title | |
| Carlson James C | -- | None Available | |
| Carlson James C | $150,000 | Professional National Title | |
| First National Bank Of Evergreen Park | -- | -- |
Source: Public Records
Tax History Compared to Growth
Tax History
| Year | Tax Paid | Tax Assessment Tax Assessment Total Assessment is a certain percentage of the fair market value that is determined by local assessors to be the total taxable value of land and additions on the property. | Land | Improvement |
|---|---|---|---|---|
| 2024 | $6,427 | $23,318 | $4,802 | $18,516 |
| 2023 | $5,527 | $23,318 | $4,802 | $18,516 |
| 2022 | $5,527 | $17,440 | $4,202 | $13,238 |
| 2021 | $5,158 | $17,440 | $4,202 | $13,238 |
| 2020 | $5,211 | $17,440 | $4,202 | $13,238 |
| 2019 | $4,959 | $17,049 | $3,801 | $13,248 |
| 2018 | $4,771 | $17,049 | $3,801 | $13,248 |
| 2017 | $5,204 | $17,976 | $3,801 | $14,175 |
| 2016 | $5,089 | $15,508 | $3,201 | $12,307 |
| 2015 | $4,966 | $15,508 | $3,201 | $12,307 |
| 2014 | $4,915 | $15,508 | $3,201 | $12,307 |
| 2013 | $5,281 | $18,030 | $3,201 | $14,829 |
Source: Public Records
Map
Nearby Homes
- 10016 Harnew Rd W
- 5120 W 101st St
- 10010 Harnew Rd W Unit 1
- 5125 W 101st St
- 10012 S 52nd Ave
- 10021 Cook Ave
- 9953 Elm Circle Dr
- 5168 W 99th St
- 5300 Oakdale Dr
- 9909 Elm Circle Dr
- 10100 Alice Ct
- 9904 S Cicero Ave
- 9711 Tulley Ave
- 5509 Oak Center Dr
- 10109 S Cicero Ave Unit 206
- 9706 S 52nd Ave
- 9828 Warren Ave
- 9821 S Cicero Ave Unit 8
- 5009 W 105th St
- 10210 Washington Ave Unit 305
- 10019 Harnew Rd W
- 10015 Harnew Rd W
- 10019 Harnew Rd W
- 10021 Harnew Rd W
- 10013 Harnew Rd W
- 5034 Elm Circle Dr
- 10011 Harnew Rd W
- 5030 Elm Circle Dr
- 5038 Elm Circle Dr
- 5108 W 101st St
- 5112 W 101st St Unit 1
- 5026 Elm Circle Dr Unit 1
- 10018 Harnew Rd W
- 5104 W 101st St
- 10009 Harnew Rd W
- 10020 Harnew Rd W
- 10009 Harnew Rd E
- 10014 Harnew Rd W
- 10022 Harnew Rd W
- 5022 Elm Circle Dr Unit 1