10019 Jacksontown Rd Thornville, OH 43076
Estimated Value: $697,000 - $855,000
5
Beds
2
Baths
3,100
Sq Ft
$257/Sq Ft
Est. Value
About This Home
This home is located at 10019 Jacksontown Rd, Thornville, OH 43076 and is currently estimated at $796,393, approximately $256 per square foot. 10019 Jacksontown Rd is a home located in Licking County with nearby schools including Jackson Intermediate School, Lakewood Middle School, and Lakewood High School.
Ownership History
Date
Name
Owned For
Owner Type
Purchase Details
Closed on
Nov 8, 2018
Sold by
Stonerock Michael and Stonerock Twila
Bought by
Harless Taylor D and Piatt Haley N
Current Estimated Value
Home Financials for this Owner
Home Financials are based on the most recent Mortgage that was taken out on this home.
Original Mortgage
$450,000
Outstanding Balance
$395,684
Interest Rate
4.8%
Mortgage Type
New Conventional
Estimated Equity
$400,709
Purchase Details
Closed on
Oct 31, 2012
Sold by
Province William L
Bought by
Stonerock Michael and Stonerock Twila
Home Financials for this Owner
Home Financials are based on the most recent Mortgage that was taken out on this home.
Original Mortgage
$420,750
Interest Rate
3.51%
Mortgage Type
Purchase Money Mortgage
Create a Home Valuation Report for This Property
The Home Valuation Report is an in-depth analysis detailing your home's value as well as a comparison with similar homes in the area
Home Values in the Area
Average Home Value in this Area
Purchase History
| Date | Buyer | Sale Price | Title Company |
|---|---|---|---|
| Harless Taylor D | $475,000 | None Available | |
| Stonerock Michael | $495,500 | Ambassador Title |
Source: Public Records
Mortgage History
| Date | Status | Borrower | Loan Amount |
|---|---|---|---|
| Open | Harless Taylor D | $450,000 | |
| Previous Owner | Stonerock Michael | $420,750 |
Source: Public Records
Tax History Compared to Growth
Tax History
| Year | Tax Paid | Tax Assessment Tax Assessment Total Assessment is a certain percentage of the fair market value that is determined by local assessors to be the total taxable value of land and additions on the property. | Land | Improvement |
|---|---|---|---|---|
| 2024 | $9,268 | $220,260 | $69,900 | $150,360 |
| 2023 | $9,278 | $220,260 | $69,900 | $150,360 |
| 2022 | $6,084 | $142,110 | $37,840 | $104,270 |
| 2021 | $6,353 | $142,110 | $37,840 | $104,270 |
| 2020 | $7,615 | $142,110 | $37,840 | $104,270 |
| 2019 | $6,431 | $142,110 | $37,840 | $104,270 |
| 2018 | $6,495 | $0 | $0 | $0 |
| 2017 | $5,533 | $0 | $0 | $0 |
| 2016 | $5,543 | $0 | $0 | $0 |
| 2015 | $5,201 | $0 | $0 | $0 |
| 2014 | $8,001 | $0 | $0 | $0 |
| 2013 | $4,769 | $0 | $0 | $0 |
Source: Public Records
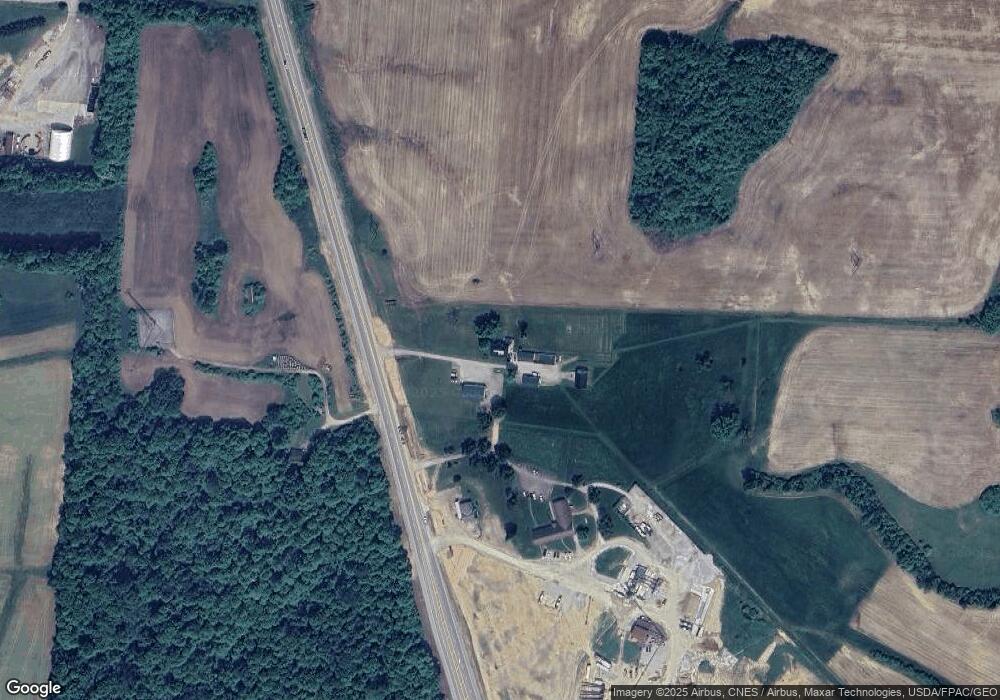
Map
Nearby Homes
- 7233 National Rd SE
- 8369 Somerset Rd
- 11790 Avondale Rd E
- 141 Sandpiper Dr
- 0 Avon Place SE Unit 410 225019607
- 132 North Ct
- 0 Harbor View Dr Unit 223038206
- 8981 Fairmont Rd
- 36 High St
- 81 Maple Ave
- 8351 Honda Hills Rd
- 541 Lakeshore Dr E
- 9507 Cypress Dr
- 459 Lakeshore Dr E
- 149 Amherst Dr
- 206 Freeman Memorial Dr
- 15172 N Canoe Ln
- 1 Shoreline Dr
- 955 Lakeshore Dr E
- 10790 Township Road 500
- 10077 Jacksontown Rd
- 10050 Jacksontown Rd
- 10022 Ohio 13
- 9669 Jacksontown Rd
- 9659 Jacksontown Rd
- 9645 Jacksontown Rd
- 9617 Jacksontown Rd
- 9595 Jacksontown Rd
- 9581 Jacksontown Rd
- 9547 Jacksontown Rd
- 0 Jacksontown Rd
- 9537 Jacksontown Rd
- 9520 Jacksontown Rd
- 9509 Jacksontown Rd
- 9510 Jacksontown Rd
- 9485 Jacksontown Rd
- 10123 Licking Trail Rd
- 9437 Jacksontown Rd
- 9427 Jacksontown Rd
- 9520 Jacksontown Rd SE