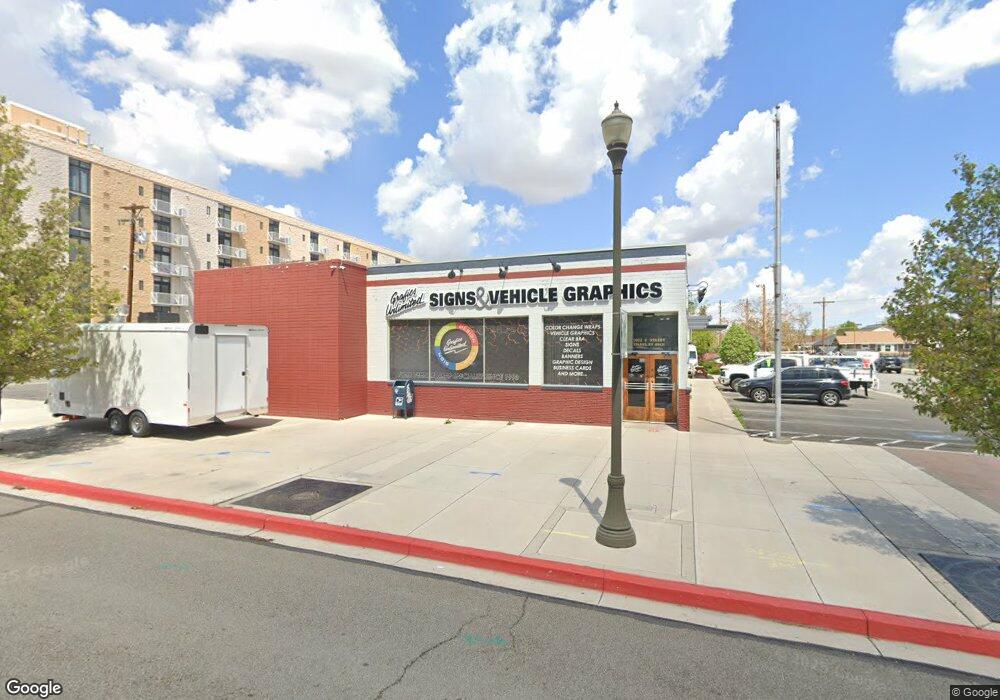
1002 C St Sparks, NV 89431
Downtown Sparks NeighborhoodEstimated Value: $1,249,510
--
Bed
--
Bath
8,223
Sq Ft
$152/Sq Ft
Est. Value
About This Home
This home is located at 1002 C St, Sparks, NV 89431 and is currently estimated at $1,249,510, approximately $151 per square foot. 1002 C St is a home located in Washoe County with nearby schools including Robert Mitchell Elementary School, Sparks Middle School, and Sparks High School.
Ownership History
Date
Name
Owned For
Owner Type
Purchase Details
Closed on
Aug 4, 2025
Sold by
Jill & Bill Pauley Llc
Bought by
Hartig Capital Group Llc
Current Estimated Value
Home Financials for this Owner
Home Financials are based on the most recent Mortgage that was taken out on this home.
Original Mortgage
$306,642
Outstanding Balance
$306,642
Interest Rate
6.74%
Estimated Equity
$942,868
Purchase Details
Closed on
May 22, 2015
Sold by
Woodward Alice L
Bought by
Jill & Bill Pauley Llc
Home Financials for this Owner
Home Financials are based on the most recent Mortgage that was taken out on this home.
Original Mortgage
$425,000
Interest Rate
3.64%
Mortgage Type
Commercial
Purchase Details
Closed on
Sep 24, 2013
Sold by
Woodward Alice L
Bought by
Woodward Alice L and Donald L Woodward Jr Bypass Trust
Create a Home Valuation Report for This Property
The Home Valuation Report is an in-depth analysis detailing your home's value as well as a comparison with similar homes in the area
Home Values in the Area
Average Home Value in this Area
Purchase History
| Date | Buyer | Sale Price | Title Company |
|---|---|---|---|
| Hartig Capital Group Llc | $1,920,000 | Ticor Title | |
| Jill & Bill Pauley Llc | $590,000 | Ticor Title Reno Commercial | |
| Woodward Alice L | -- | None Available |
Source: Public Records
Mortgage History
| Date | Status | Borrower | Loan Amount |
|---|---|---|---|
| Open | Hartig Capital Group Llc | $306,642 | |
| Open | Hartig Capital Group Llc | $988,000 | |
| Previous Owner | Jill & Bill Pauley Llc | $425,000 |
Source: Public Records
Tax History Compared to Growth
Tax History
| Year | Tax Paid | Tax Assessment Tax Assessment Total Assessment is a certain percentage of the fair market value that is determined by local assessors to be the total taxable value of land and additions on the property. | Land | Improvement |
|---|---|---|---|---|
| 2025 | $4,633 | $143,838 | $54,789 | $89,049 |
| 2024 | $4,633 | $138,091 | $49,022 | $89,069 |
| 2023 | $4,291 | $123,257 | $43,255 | $80,002 |
| 2022 | $3,974 | $108,422 | $43,255 | $65,168 |
| 2021 | $3,706 | $101,125 | $37,487 | $63,638 |
| 2020 | $3,948 | $107,499 | $43,255 | $64,244 |
| 2019 | $3,783 | $102,967 | $43,255 | $59,712 |
| 2018 | $3,739 | $101,782 | $43,255 | $58,527 |
| 2017 | $3,728 | $101,176 | $43,255 | $57,921 |
| 2016 | $3,655 | $100,640 | $43,255 | $57,385 |
| 2015 | $3,648 | $99,560 | $43,255 | $56,305 |
| 2014 | $3,565 | $97,983 | $43,255 | $54,728 |
| 2013 | -- | $95,592 | $43,255 | $52,337 |
Source: Public Records
Map
Nearby Homes