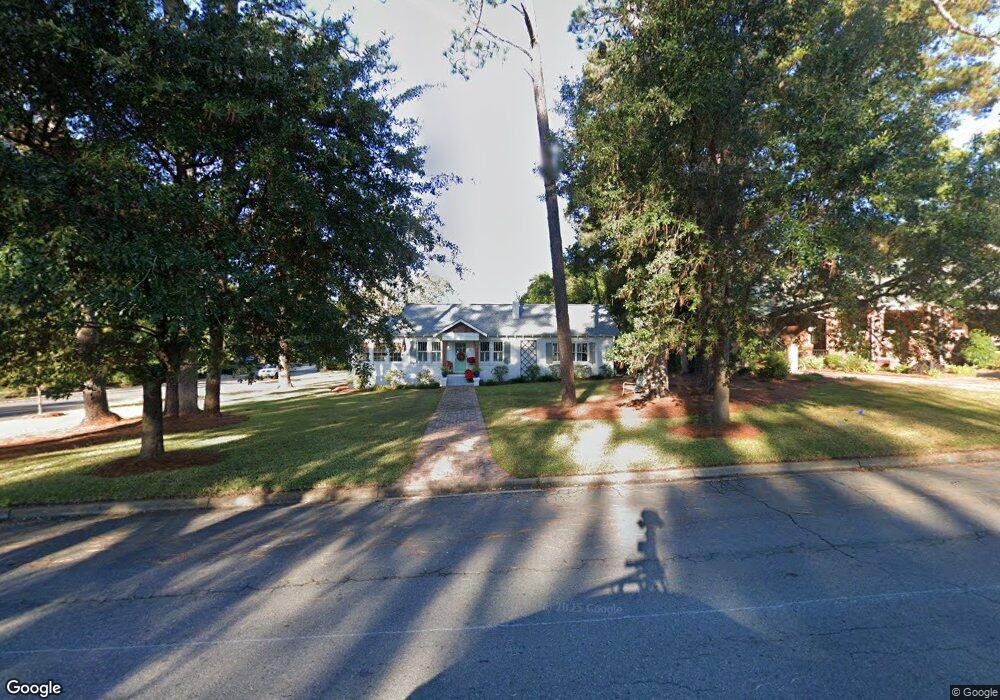
1002 College Ave N Tifton, GA 31794
Estimated Value: $230,000 - $292,000
3
Beds
2
Baths
1,821
Sq Ft
$139/Sq Ft
Est. Value
About This Home
This home is located at 1002 College Ave N, Tifton, GA 31794 and is currently estimated at $253,067, approximately $138 per square foot. 1002 College Ave N is a home located in Tift County with nearby schools including Len Lastinger Primary School, Charles Spencer Elementary School, and J.T. Reddick School.
Ownership History
Date
Name
Owned For
Owner Type
Purchase Details
Closed on
Jun 2, 2008
Sold by
Robinson Celeste Sumner
Bought by
Robbins Jeffrey W
Current Estimated Value
Home Financials for this Owner
Home Financials are based on the most recent Mortgage that was taken out on this home.
Original Mortgage
$194,940
Outstanding Balance
$124,900
Interest Rate
6.02%
Mortgage Type
FHA
Estimated Equity
$128,167
Purchase Details
Closed on
Nov 7, 2000
Sold by
Community National Bank
Bought by
Sumner Celeste
Purchase Details
Closed on
Oct 3, 2000
Sold by
Cater James G
Bought by
Community National Bank
Purchase Details
Closed on
Mar 10, 1998
Sold by
Gaulding James Gregory and Rita Faye Ross
Bought by
Cater James G
Purchase Details
Closed on
Jul 9, 1996
Sold by
Gaulding Lila W
Bought by
Gaulding James Gregory and Rita Faye
Create a Home Valuation Report for This Property
The Home Valuation Report is an in-depth analysis detailing your home's value as well as a comparison with similar homes in the area
Home Values in the Area
Average Home Value in this Area
Purchase History
| Date | Buyer | Sale Price | Title Company |
|---|---|---|---|
| Robbins Jeffrey W | $212,000 | -- | |
| Sumner Celeste | $78,300 | -- | |
| Community National Bank | $86,000 | -- | |
| Cater James G | $66,000 | -- | |
| Gaulding James Gregory | -- | -- |
Source: Public Records
Mortgage History
| Date | Status | Borrower | Loan Amount |
|---|---|---|---|
| Open | Robbins Jeffrey W | $194,940 |
Source: Public Records
Tax History Compared to Growth
Tax History
| Year | Tax Paid | Tax Assessment Tax Assessment Total Assessment is a certain percentage of the fair market value that is determined by local assessors to be the total taxable value of land and additions on the property. | Land | Improvement |
|---|---|---|---|---|
| 2024 | $2,702 | $104,083 | $12,600 | $91,483 |
| 2023 | $2,876 | $54,546 | $8,000 | $46,546 |
| 2022 | $1,925 | $55,124 | $8,000 | $47,124 |
| 2021 | $1,937 | $55,124 | $8,000 | $47,124 |
| 2020 | $1,984 | $55,124 | $8,000 | $47,124 |
| 2019 | $1,985 | $55,124 | $8,000 | $47,124 |
| 2018 | $1,986 | $55,124 | $8,000 | $47,124 |
| 2017 | $2,039 | $55,124 | $8,000 | $47,124 |
| 2016 | $2,006 | $54,222 | $8,000 | $46,222 |
| 2015 | $2,009 | $54,222 | $8,000 | $46,222 |
| 2014 | $2,011 | $54,222 | $8,000 | $46,222 |
| 2013 | -- | $54,221 | $8,000 | $46,221 |
Source: Public Records
Map
Nearby Homes
- 821 Murray Ave
- 801 Ridge Ave N
- 803 Forest Ave
- 803 Forrest Ave
- 15 acres Us Highway 41
- 33.7 ac Us Highway 41
- 48 acres Us Highway 41
- 416 6th St W
- 711 10th St W
- 1601 Murray Ave
- 0 Penn Place
- 401 Park Ave N
- 1617 Wilson Ave N
- 0 Lee Ball Rd
- 810 Tift Ave N
- 0 Central Ave Unit 138182
- 0 Central Ave Unit 137897
- 0 Central Ave Unit 137896
- 0 Central Ave Unit 137898
- 0 Central Ave Unit 137895
- 1006 College Ave N
- 10th 10th St W
- N N College Ave
- 1010 College Ave N
- 820 College Ave N
- 412 10th St W
- 1001 College Ave N
- 1003 Wilson Ave N
- 421 10th St W
- 1018 College Ave N
- 1005 Wilson Ave N
- 420 10th St W
- 814 College Ave N
- 817 Wilson Ave N
- 1009 College Ave N
- 311 10th St W
- 310 10th St W
- 1009 Wilson Ave N
- 1015 College Ave N
- 809 Wilson Ave N