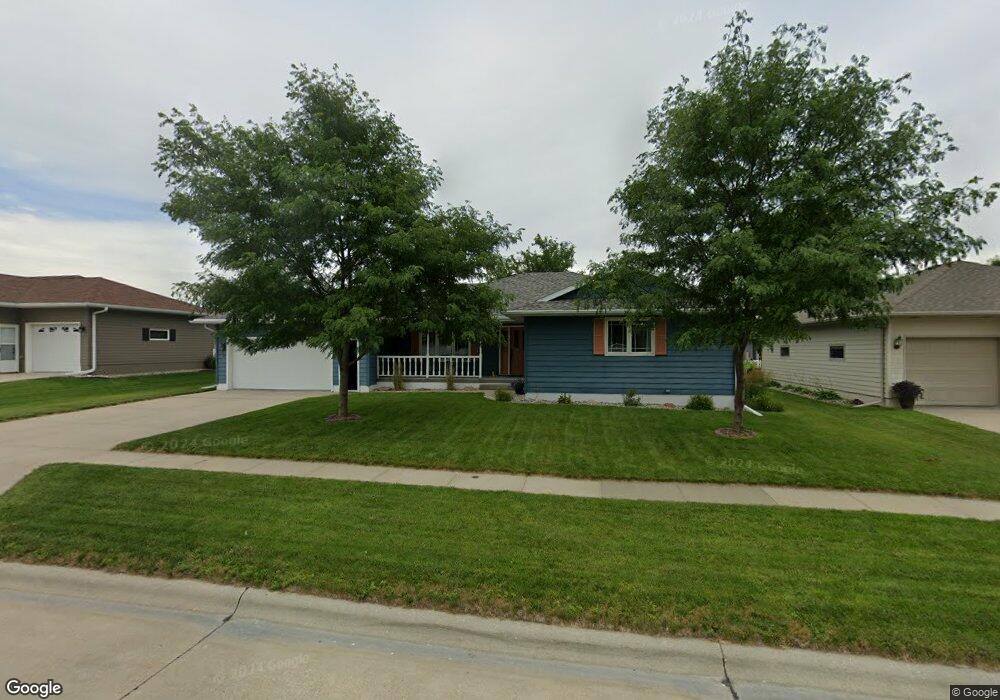
1002 E Knolls St Norfolk, NE 68701
Estimated Value: $314,773 - $369,000
3
Beds
3
Baths
1,652
Sq Ft
$212/Sq Ft
Est. Value
About This Home
This home is located at 1002 E Knolls St, Norfolk, NE 68701 and is currently estimated at $350,693, approximately $212 per square foot. 1002 E Knolls St is a home located in Madison County with nearby schools including Norfolk Senior High School, Keystone Christian Academy, and Park Avenue Christian School.
Ownership History
Date
Name
Owned For
Owner Type
Purchase Details
Closed on
Sep 15, 2006
Sold by
Pfeiffer Vicky L
Bought by
Mrsny Larry L and Mrsny Georgianna L
Current Estimated Value
Home Financials for this Owner
Home Financials are based on the most recent Mortgage that was taken out on this home.
Original Mortgage
$152,500
Interest Rate
6.55%
Mortgage Type
New Conventional
Purchase Details
Closed on
Sep 11, 2006
Sold by
Pfeiffer Vicky L
Bought by
Mrysny Larry L and Mrysny Goergianna L
Home Financials for this Owner
Home Financials are based on the most recent Mortgage that was taken out on this home.
Original Mortgage
$152,500
Interest Rate
6.55%
Mortgage Type
New Conventional
Purchase Details
Closed on
Jan 26, 2004
Sold by
Bauer Margery A
Bought by
Community Housing Inc
Purchase Details
Closed on
Jan 15, 2004
Sold by
Community Housing Inc
Bought by
Pfeiffer Vicky L
Create a Home Valuation Report for This Property
The Home Valuation Report is an in-depth analysis detailing your home's value as well as a comparison with similar homes in the area
Home Values in the Area
Average Home Value in this Area
Purchase History
| Date | Buyer | Sale Price | Title Company |
|---|---|---|---|
| Mrsny Larry L | $153,500 | -- | |
| Mrysny Larry L | $154,000 | American Title & Escrow | |
| Community Housing Inc | $135,000 | -- | |
| Pfeiffer Vicky L | $135,000 | -- |
Source: Public Records
Mortgage History
| Date | Status | Borrower | Loan Amount |
|---|---|---|---|
| Closed | Mrysny Larry L | $152,500 |
Source: Public Records
Tax History Compared to Growth
Tax History
| Year | Tax Paid | Tax Assessment Tax Assessment Total Assessment is a certain percentage of the fair market value that is determined by local assessors to be the total taxable value of land and additions on the property. | Land | Improvement |
|---|---|---|---|---|
| 2024 | $3,482 | $271,217 | $29,532 | $241,685 |
| 2023 | $3,878 | $209,784 | $19,196 | $190,588 |
| 2022 | $3,510 | $189,364 | $19,196 | $170,168 |
| 2021 | $3,243 | $175,313 | $19,196 | $156,117 |
| 2020 | $3,234 | $175,313 | $19,196 | $156,117 |
| 2019 | $3,102 | $162,423 | $19,196 | $143,227 |
| 2018 | $2,927 | $155,838 | $19,196 | $136,642 |
| 2017 | $2,745 | $145,963 | $19,196 | $126,767 |
| 2016 | $2,658 | $141,023 | $19,196 | $121,827 |
| 2015 | $2,658 | $141,023 | $19,196 | $121,827 |
| 2014 | $2,738 | $141,023 | $19,196 | $121,827 |
| 2013 | $2,826 | $141,023 | $19,196 | $121,827 |
Source: Public Records
Map
Nearby Homes
- 1000 E Knolls St
- 1004 E Knolls St
- 1003 Eastridge St
- 1001 Eastridge St
- 1005 Eastridge St
- 906 E Knolls St
- 403 Woodcrest Place
- 1307 E Cedar Ave
- 907 Eastridge St
- 1401 E Sycamore Ave
- 1005 E Knolls St
- 904 E Knolls St
- 905 Eastridge St
- 1403 E Sycamore Ave
- 1002 Nord St
- 1007 E Knolls St
- 1004 Nord St
- 1305 E Cedar Ave
- 1306 E Cedar Ave
- 1002 Eastridge St