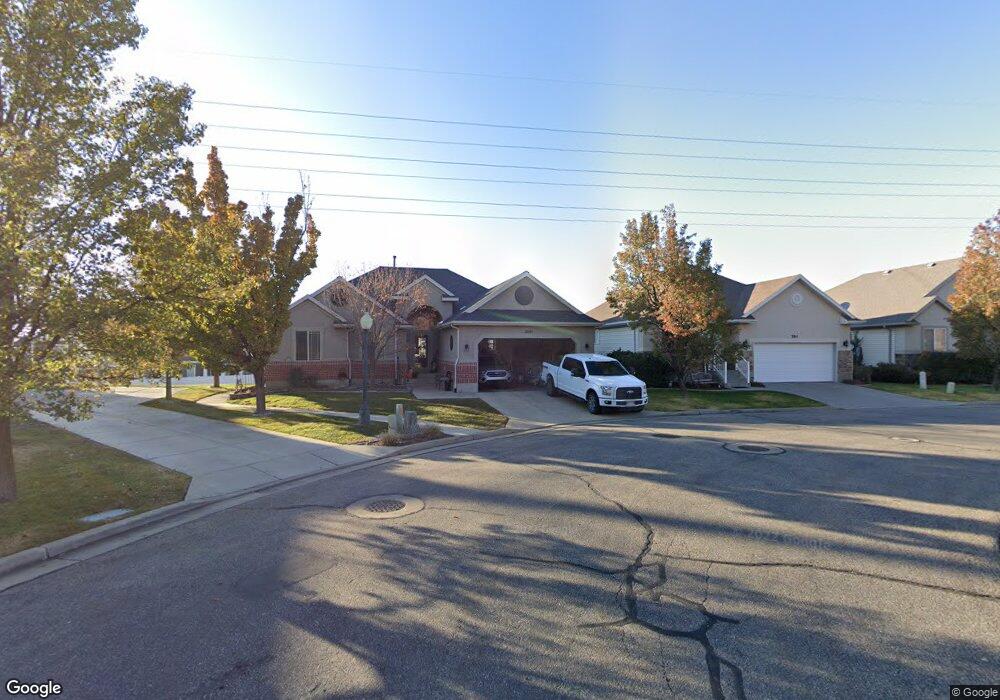
1002 E Wyndom Way Layton, UT 84040
Estimated Value: $503,000 - $559,207
5
Beds
3
Baths
3,163
Sq Ft
$167/Sq Ft
Est. Value
About This Home
This home is located at 1002 E Wyndom Way, Layton, UT 84040 and is currently estimated at $529,552, approximately $167 per square foot. 1002 E Wyndom Way is a home located in Davis County with nearby schools including Sarah Jane Adams Elementary School, North Layton Junior High School, and Northridge High School.
Ownership History
Date
Name
Owned For
Owner Type
Purchase Details
Closed on
Apr 12, 2013
Sold by
Anthony Joseph Chris
Bought by
Kirchner Sieglinde
Current Estimated Value
Home Financials for this Owner
Home Financials are based on the most recent Mortgage that was taken out on this home.
Original Mortgage
$238,405
Outstanding Balance
$167,702
Interest Rate
3.47%
Mortgage Type
VA
Estimated Equity
$361,851
Purchase Details
Closed on
Aug 18, 2003
Sold by
Harrison Charles L
Bought by
Anthony Joseph Chris
Home Financials for this Owner
Home Financials are based on the most recent Mortgage that was taken out on this home.
Original Mortgage
$182,875
Interest Rate
5.46%
Mortgage Type
Purchase Money Mortgage
Purchase Details
Closed on
Oct 24, 2001
Sold by
Gmw Development Inc
Bought by
Harrison Charles L
Home Financials for this Owner
Home Financials are based on the most recent Mortgage that was taken out on this home.
Original Mortgage
$202,100
Interest Rate
6.87%
Mortgage Type
VA
Create a Home Valuation Report for This Property
The Home Valuation Report is an in-depth analysis detailing your home's value as well as a comparison with similar homes in the area
Home Values in the Area
Average Home Value in this Area
Purchase History
| Date | Buyer | Sale Price | Title Company |
|---|---|---|---|
| Kirchner Sieglinde | -- | None Available | |
| Anthony Joseph Chris | -- | Backman Stewart Title Servic | |
| Harrison Charles L | -- | Bonneville Title Company Inc |
Source: Public Records
Mortgage History
| Date | Status | Borrower | Loan Amount |
|---|---|---|---|
| Open | Kirchner Sieglinde | $238,405 | |
| Previous Owner | Anthony Joseph Chris | $182,875 | |
| Previous Owner | Harrison Charles L | $202,100 |
Source: Public Records
Tax History
| Year | Tax Paid | Tax Assessment Tax Assessment Total Assessment is a certain percentage of the fair market value that is determined by local assessors to be the total taxable value of land and additions on the property. | Land | Improvement |
|---|---|---|---|---|
| 2025 | $2,817 | $266,750 | $84,504 | $182,246 |
| 2024 | $2,614 | $249,149 | $107,856 | $141,293 |
| 2023 | $2,694 | $251,900 | $84,384 | $167,515 |
| 2022 | $2,826 | $479,000 | $148,324 | $330,676 |
| 2021 | $2,637 | $366,000 | $123,015 | $242,985 |
| 2020 | $2,583 | $345,000 | $95,202 | $249,798 |
| 2019 | $2,502 | $329,000 | $85,979 | $243,021 |
| 2018 | $2,313 | $305,000 | $48,566 | $256,434 |
| 2016 | $2,065 | $142,781 | $30,201 | $112,580 |
| 2015 | $1,982 | $129,966 | $30,201 | $99,765 |
| 2014 | $2,060 | $138,619 | $30,201 | $108,418 |
| 2013 | -- | $131,055 | $28,435 | $102,620 |
Source: Public Records
Map
Nearby Homes
- 948 E Hercules Ct Unit 179
- 2529 N 1000 E
- 1292 E 2675 N
- 1447 E 2700 N
- 1266 E 3125 N
- 935 E 3000 N Unit 183
- 935 E 3000 N Unit 175
- 935 E 3000 N Unit 165
- 935 E 3000 N Unit 26
- 935 E 3000 N Unit 90
- 935 E 3000 N Unit 27
- 935 E Highway 193 Unit 102
- 935 E 3000 N Unit 56
- 1321 E 3125 N
- 1444 E 2400 N
- 3176 N 1450 E
- 2826 N 1600 E
- 1120 E 2200 N
- 3306 N Fairfield Rd
- 1505 E 3225 N
- 1012 E Wyndom Way
- 2801 N Wyndom Way
- 1023 E Nicholes Ave
- 1020 E Wyndom Way
- 1033 E Nicholes Ave
- 1019 E Nicholes Ave Unit 220
- 1015 E Wyndom Way
- 2811 N Wyndom Way
- 1043 E Nicholes Ave
- 1032 E Wyndom Way
- 1027 E Wyndom Way
- 2831 N Wyndom Way
- 2752 N Fighting Falcon St
- 2748 N Fighting Falcon St
- 2754 N Fighting Falcon St
- 2756 N Fighting Falcon St
- 1051 E Nicholes Ave Unit 224
- 2760 N Fighting Falcon St
- 1039 E Wyndom Way
- 1040 E Wyndom Way
Your Personal Tour Guide
Ask me questions while you tour the home.