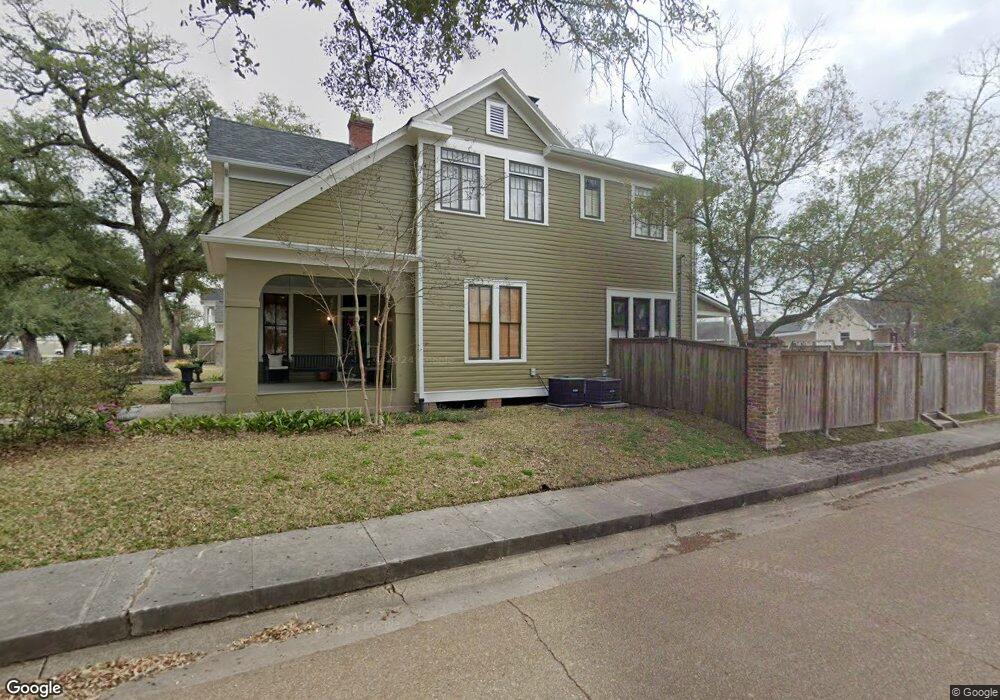
1002 Kirby St Lake Charles, LA 70601
Charpentier Historic District NeighborhoodEstimated Value: $366,000 - $609,000
4
Beds
2
Baths
3,547
Sq Ft
$128/Sq Ft
Est. Value
About This Home
This home is located at 1002 Kirby St, Lake Charles, LA 70601 and is currently estimated at $452,483, approximately $127 per square foot. 1002 Kirby St is a home located in Calcasieu Parish with nearby schools including John J. Johnson II Elementary School, Ralph F. Wilson Elementary School, and Ray D. Molo Middle School.
Ownership History
Date
Name
Owned For
Owner Type
Purchase Details
Closed on
May 13, 2014
Sold by
Cooke Joshua Gregory and Cooke Eleisha Marie
Bought by
Catchings Foret Ryan Thomas and Catchings Foret Elise
Current Estimated Value
Home Financials for this Owner
Home Financials are based on the most recent Mortgage that was taken out on this home.
Original Mortgage
$361,000
Outstanding Balance
$276,456
Interest Rate
4.46%
Mortgage Type
Unknown
Estimated Equity
$176,027
Purchase Details
Closed on
Mar 19, 2009
Sold by
Filkins James A and Filkins Stephen W
Bought by
Eagle Eleisha
Home Financials for this Owner
Home Financials are based on the most recent Mortgage that was taken out on this home.
Original Mortgage
$135,000
Interest Rate
5.14%
Mortgage Type
Purchase Money Mortgage
Create a Home Valuation Report for This Property
The Home Valuation Report is an in-depth analysis detailing your home's value as well as a comparison with similar homes in the area
Home Values in the Area
Average Home Value in this Area
Purchase History
| Date | Buyer | Sale Price | Title Company |
|---|---|---|---|
| Catchings Foret Ryan Thomas | $440,000 | None Available | |
| Eagle Eleisha | $155,000 | None Available |
Source: Public Records
Mortgage History
| Date | Status | Borrower | Loan Amount |
|---|---|---|---|
| Open | Catchings Foret Ryan Thomas | $361,000 | |
| Previous Owner | Eagle Eleisha | $135,000 |
Source: Public Records
Tax History Compared to Growth
Tax History
| Year | Tax Paid | Tax Assessment Tax Assessment Total Assessment is a certain percentage of the fair market value that is determined by local assessors to be the total taxable value of land and additions on the property. | Land | Improvement |
|---|---|---|---|---|
| 2024 | $3,785 | $39,690 | $2,690 | $37,000 |
| 2023 | $3,785 | $39,690 | $2,690 | $37,000 |
| 2022 | $3,818 | $39,690 | $2,690 | $37,000 |
| 2021 | $3,554 | $39,690 | $2,690 | $37,000 |
| 2020 | $4,642 | $35,880 | $2,580 | $33,300 |
| 2019 | $5,311 | $39,490 | $2,490 | $37,000 |
| 2018 | $4,043 | $39,490 | $2,490 | $37,000 |
| 2017 | $820 | $7,220 | $2,490 | $4,730 |
| 2016 | $816 | $7,220 | $2,490 | $4,730 |
| 2015 | $816 | $7,220 | $2,490 | $4,730 |
Source: Public Records
Map
Nearby Homes
- 827 Clarence St
- 1202 Louisiana Ave
- 1010 Enterprise Blvd
- 905 Pujo St
- 1012 Broad St
- 920 Broad St
- 715 Iris St
- 1300 3rd St
- 0 Clement St
- 1400 Bank St
- 0 Iris St
- 638 Iris St
- 1409 Louisiana Ave
- 716 Clarence St
- 0 Bank St
- 1428 Enterprise Blvd
- 900 S Division St
- 619 Clarence St
- 738 Kirkman St
- 740 V E Washington St