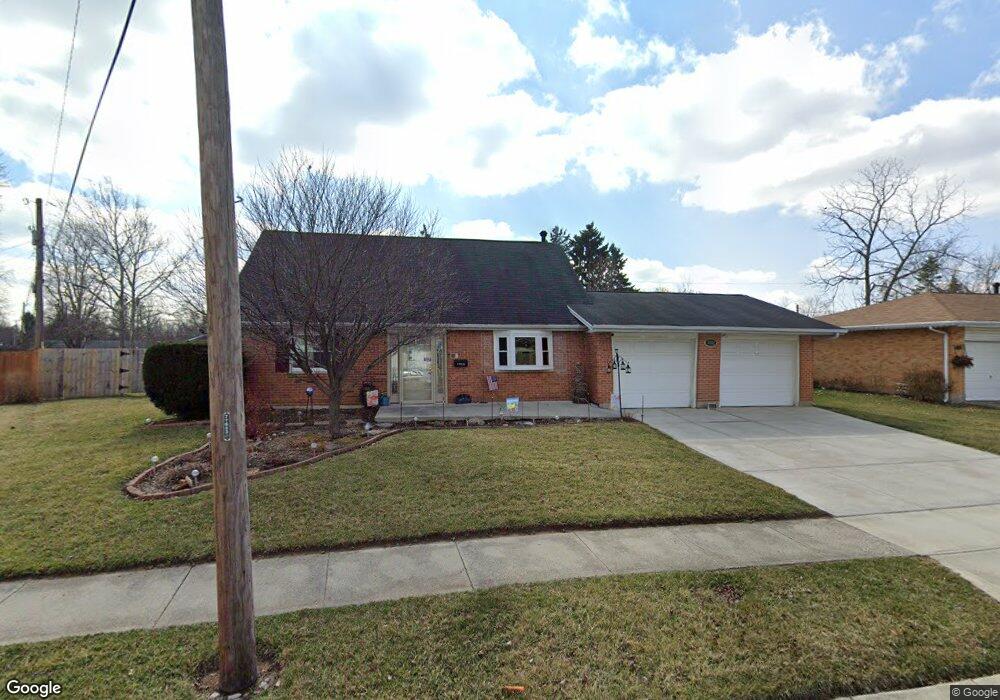
1002 Langdale Ave New Carlisle, OH 45344
Estimated Value: $169,000 - $236,000
3
Beds
2
Baths
1,380
Sq Ft
$154/Sq Ft
Est. Value
About This Home
This home is located at 1002 Langdale Ave, New Carlisle, OH 45344 and is currently estimated at $212,474, approximately $153 per square foot. 1002 Langdale Ave is a home located in Clark County with nearby schools including New Carlisle Elementary School, Park Layne Elementary School, and Donnelsville Elementary School.
Ownership History
Date
Name
Owned For
Owner Type
Purchase Details
Closed on
Aug 13, 2009
Sold by
Federal Home Loan Mortgage Corporation
Bought by
Haecherl James W and Haecherl Bridget A
Current Estimated Value
Home Financials for this Owner
Home Financials are based on the most recent Mortgage that was taken out on this home.
Original Mortgage
$85,612
Outstanding Balance
$56,047
Interest Rate
5.29%
Mortgage Type
Purchase Money Mortgage
Estimated Equity
$156,427
Purchase Details
Closed on
Apr 29, 2009
Sold by
Ohsner Dewayne C
Bought by
Federal Home Loan Mortgage Corp
Purchase Details
Closed on
Nov 5, 1997
Sold by
Maurer Darla S
Bought by
Ohsner Dewayne C and Ohsner Theresa
Home Financials for this Owner
Home Financials are based on the most recent Mortgage that was taken out on this home.
Original Mortgage
$72,000
Interest Rate
7.42%
Mortgage Type
New Conventional
Create a Home Valuation Report for This Property
The Home Valuation Report is an in-depth analysis detailing your home's value as well as a comparison with similar homes in the area
Home Values in the Area
Average Home Value in this Area
Purchase History
| Date | Buyer | Sale Price | Title Company |
|---|---|---|---|
| Haecherl James W | $83,900 | None Available | |
| Federal Home Loan Mortgage Corp | $65,000 | None Available | |
| Ohsner Dewayne C | $90,000 | -- |
Source: Public Records
Mortgage History
| Date | Status | Borrower | Loan Amount |
|---|---|---|---|
| Open | Haecherl James W | $85,612 | |
| Previous Owner | Ohsner Dewayne C | $72,000 |
Source: Public Records
Tax History Compared to Growth
Tax History
| Year | Tax Paid | Tax Assessment Tax Assessment Total Assessment is a certain percentage of the fair market value that is determined by local assessors to be the total taxable value of land and additions on the property. | Land | Improvement |
|---|---|---|---|---|
| 2024 | $2,558 | $50,020 | $8,860 | $41,160 |
| 2023 | $2,558 | $50,020 | $8,860 | $41,160 |
| 2022 | $2,562 | $50,020 | $8,860 | $41,160 |
| 2021 | $2,271 | $39,220 | $6,810 | $32,410 |
| 2020 | $2,277 | $39,220 | $6,810 | $32,410 |
| 2019 | $2,314 | $39,220 | $6,810 | $32,410 |
| 2018 | $1,935 | $30,400 | $6,950 | $23,450 |
| 2017 | $1,805 | $37,384 | $6,951 | $30,433 |
| 2016 | $1,795 | $37,384 | $6,951 | $30,433 |
| 2015 | $1,884 | $36,607 | $6,815 | $29,792 |
| 2014 | $1,870 | $36,607 | $6,815 | $29,792 |
| 2013 | $1,874 | $36,607 | $6,815 | $29,792 |
Source: Public Records
Map
Nearby Homes
- 210 Zimmerman St
- 805 Brookfield Dr
- 315 Fenwick Dr
- 211 N Clay St
- 907 White Pine St
- 202 Fenwick Dr
- 315 N Main St
- 906 N Scott St
- 1204 N Scott St
- 203 Monroe Way
- 1212 N Scott St
- 1206 N Scott St
- 1205 N Scott St
- 1209 N Scott St
- 1210 N Scott St
- Spruce Plan at Monroe Meadows
- Norway Plan at Monroe Meadows
- 201 Monroe Way
- Cooper Plan at Monroe Meadows
- Chestnut Plan at Monroe Meadows
- 1004 Langdale Ave
- 1000 Langdale Ave
- 1003 Corona Cir
- 1005 Corona Cir
- 409 Zimmerman St
- 1001 Langdale Ave
- 1006 Langdale Ave
- 407 Zimmerman St
- 1003 Langdale Ave
- 505 Hamilton Ave
- 1002 Corona Cir
- 507 Hamilton Ave
- 1005 Langdale Ave
- 503 Zimmerman St
- 1008 Langdale Ave
- 405 Zimmerman St
- 410 Zimmerman St
- 500 Zimmerman St
- 408 Zimmerman St
- 1004 Corona Cir