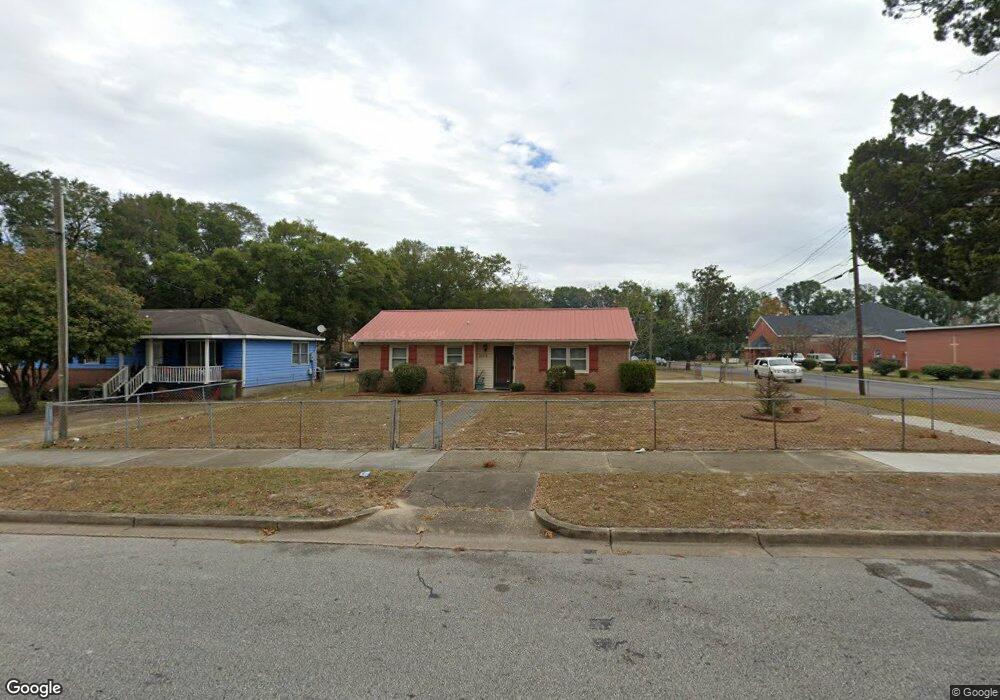
1002 N 8th St Wilmington, NC 28401
Northside NeighborhoodEstimated Value: $363,000 - $435,000
3
Beds
2
Baths
1,454
Sq Ft
$265/Sq Ft
Est. Value
About This Home
This home is located at 1002 N 8th St, Wilmington, NC 28401 and is currently estimated at $384,722, approximately $264 per square foot. 1002 N 8th St is a home located in New Hanover County with nearby schools including Snipes Academy of Arts & Design, Williston Middle School, and New Hanover High School.
Ownership History
Date
Name
Owned For
Owner Type
Purchase Details
Closed on
May 1, 1984
Sold by
Britanny Development Group
Bought by
Davis Eddie Lee Valeria H
Current Estimated Value
Purchase Details
Closed on
Apr 1, 1984
Sold by
Britanny Development Group
Bought by
Britanny Development Group
Purchase Details
Closed on
Aug 1, 1983
Sold by
City Of Wilm
Bought by
Britanny Development Group
Purchase Details
Closed on
Jan 1, 1978
Sold by
City Of Wilm
Bought by
City Of Wilm
Purchase Details
Closed on
May 1, 1973
Bought by
City Of Wilm
Create a Home Valuation Report for This Property
The Home Valuation Report is an in-depth analysis detailing your home's value as well as a comparison with similar homes in the area
Home Values in the Area
Average Home Value in this Area
Purchase History
| Date | Buyer | Sale Price | Title Company |
|---|---|---|---|
| Davis Eddie Lee Valeria H | $46,000 | -- | |
| Britanny Development Group | -- | -- | |
| Britanny Development Group | $9,000 | -- | |
| City Of Wilm | -- | -- | |
| City Of Wilm | -- | -- |
Source: Public Records
Tax History Compared to Growth
Tax History
| Year | Tax Paid | Tax Assessment Tax Assessment Total Assessment is a certain percentage of the fair market value that is determined by local assessors to be the total taxable value of land and additions on the property. | Land | Improvement |
|---|---|---|---|---|
| 2023 | $1,776 | $249,100 | $54,800 | $194,300 |
| 2022 | $1,735 | $249,100 | $54,800 | $194,300 |
| 2021 | $1,747 | $249,100 | $54,800 | $194,300 |
| 2020 | $934 | $133,700 | $44,000 | $89,700 |
| 2019 | $934 | $133,700 | $44,000 | $89,700 |
| 2018 | $934 | $133,700 | $44,000 | $89,700 |
| 2017 | $934 | $133,700 | $44,000 | $89,700 |
| 2016 | $1,098 | $144,100 | $43,000 | $101,100 |
| 2015 | $1,049 | $144,100 | $43,000 | $101,100 |
| 2014 | $927 | $136,400 | $43,000 | $93,400 |
Source: Public Records
Map
Nearby Homes